当前位置:网站首页>Matlab program for natural gas flow calculation
Matlab program for natural gas flow calculation
2022-07-24 13:46:00 【Electromagnetic matlab】
Natural gas flow calculation matlab Program
1 Natural gas tide calculation theory
Because natural gas involves the motion equation of fluid , Direct calculation is very complicated , Therefore, some assumptions need to be made in advance to simplify the calculation , After study , Appropriate assumptions have little effect on the results , Therefore, this paper makes the following assumptions for the natural gas system :
1) The natural gas in the pipeline is isothermal , The gas temperature will not change with the transmission distance ;
2) The friction coefficient of each pipeline to natural gas is the same ;
(3) The gas compression factor of each pipe is the same .
If natural gas is compared to the power network trend , Then the approximate flow equation can also be obtained , Such as the type 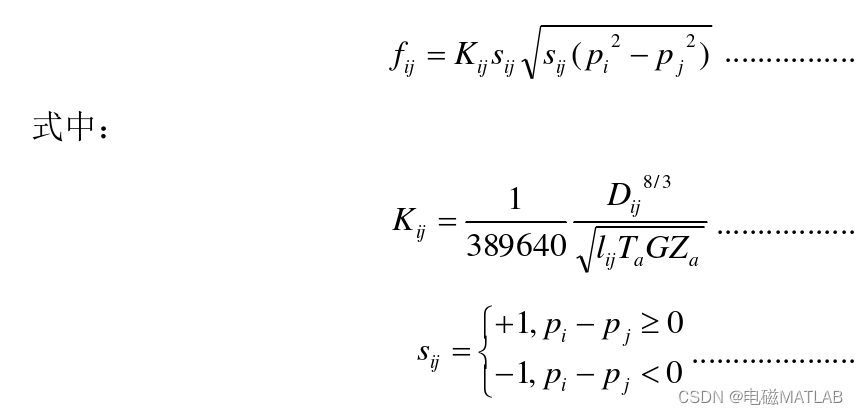
Besides , Because natural gas will produce pressure loss when it is transmitted in the pipeline , Therefore, compressors should be set every other section to increase the node pressure , Ensure the normal operation of natural gas system . The electric energy consumed by the compressor can be calculated from the formula 

All parts of the natural gas network can be described by traffic . Analogy to power network , The node flow balance equation can also be obtained , Such as the type 
Constraints of pipes or nodes , For example, traffic 、 Node pressure 、 The compressor consumes electric energy and compression ratio , As shown in the following four formulas .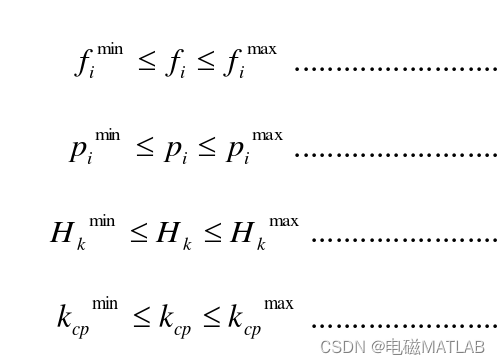
The calculation steps are as follows :
(1) The power of the micro gas turbine is obtained from the user load 𝑃g, Calculate the natural gas flow consumed ;
(2) According to the relationship between natural gas node pressure and flow between nodes, the node pressure of the previous node is calculated ;
(3) If there is a compressor in the node , Then the equivalent natural gas flow consumed by the compressor can be obtained , Add it as a load to the power flow calculation ;
(4) Find the node flow equation of the node ;
(5) Repeat step (2)-(4), Until the power flow of the whole natural gas network is solved .
2 Example structure of natural gas flow calculation 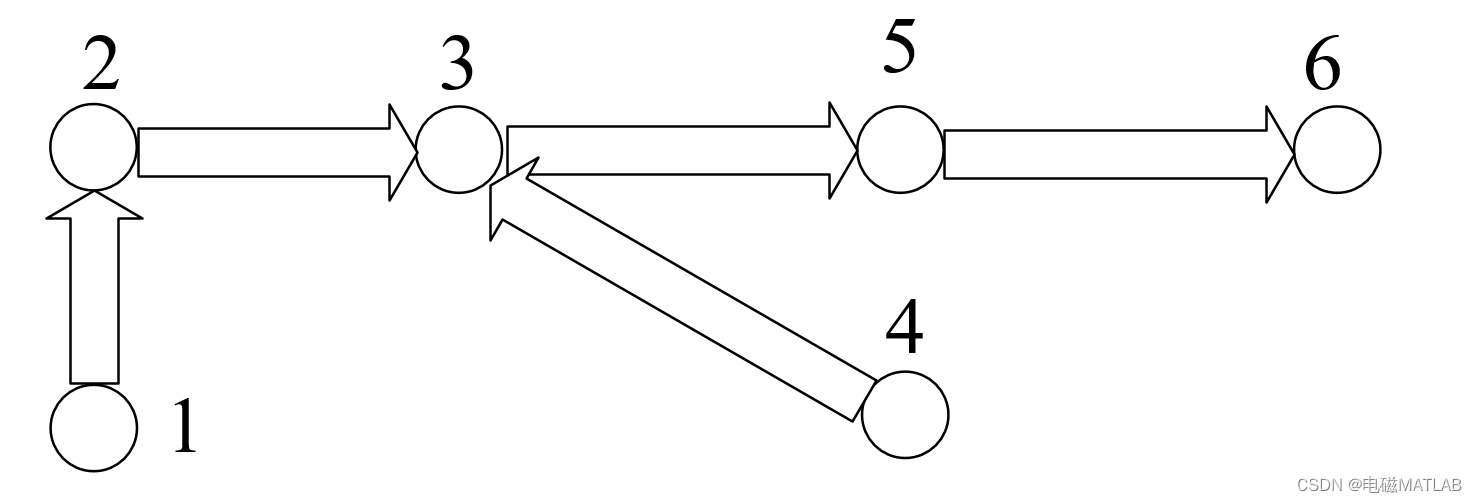
3 matlab Program
1) The main function
% function: Calculate the natural gas tide
% Node type  	 label
% Common node  	   2,3,4,5
% Constant pressure node  	   1
% Constant voltage and constant current node   6
% It can calculate the natural gas flow given various basic data , Including the pressure and flow of each node

clear % Clear workspace variables
clc % Clear the screen

%%  data input ( Unit value )
% Natural gas pipeline parameters : Pipe No   length   The inner diameter   Pipe constant K
Pline=[1, 500, 0.10, 0;
	   2, 400, 0.07, 0;
	   3, 300, 0.05, 0;
       4, 400, 0.07, 0;
	   5, 600, 0.07, 0];

% Store the flow and pressure of each node
fp=[0,   0,   0,  50,   0,   0;
    5,   0,   0,   0,   0, 5.5];

LHV=9.7;  % Low calorific value of natural gas
PeMT=50;  % Electromechanical power of micro gas turbine
yitaE=0.3;% Power generation efficiency of micro gas turbine
Bk=3.8e7; % Constant in the calculation formula of equivalent electric energy consumed by the compressor
Zk=0.92;  % Compressor compression factor

% Calculate the pipe constant K
n=size(Pline,1);
for i=1:size(Pline,1)
    Pline(i,4)=389640*Pline(i,3)^(4/3)/sqrt(Pline(i,2)*293*0.6*0.92);
end
disp(Pline)

% Calculate the amount of gas consumed by the micro gas turbine
fp(1,6)=PeMT/yitaE/LHV;

%%  Solve the natural gas tide
% Main circulation
for p=3:1e-5:5.5
    Hk=Bk*fp(1,6)*((fp(2,6)/p)^(Zk*0.3/1.3)-1);
    f6=1.07e-7*Hk;
    fp(1,5)=f6+fp(1,6);
    fp(2,5)=Pi(fp(1,5),p,Pline(5,4),1);% Find out 5 Node pressure value
    fp(2,3)=Pi(fp(1,5),fp(2,5),Pline(4,4),1);% Find out 3 Node pressure value
    fp(2,4)=Pi(fp(1,4),fp(2,3),Pline(3,4),2);% Find out 4 Node pressure value
    fp(1,3)=fp(1,4)+fp(1,5);%3 The total node flow is equal to 4、5 Sum of node traffic
    fp(2,2)=Pi(fp(1,3),fp(2,3),Pline(2,4),1);% Find out 2 Node pressure value
    fp(1,2)=fp(1,3)+15; %2 Node traffic is 3 Node traffic +2 Node load
    fp(1,1)=Pi(fp(1,2),fp(2,2),Pline(1,4),1);% Find out 1 Node pressure value

    wucha=5-fp(1,1);
    if (wucha<1e-5 )
		break;
    end
end
%%   Output power flow calculation results
disp(fp);

..... A little
4 Complete program link :
https://mp.weixin.qq.com/s?__biz=Mzg4MTc1MjE2Mg==&mid=2247484384&idx=1&sn=3fce6aa702297f2562f7cbc845f48896&chksm=cf6062edf817ebfb48496fd29aec993f7a0af5ca71e433f9ebb2d8d60697495186ee83a0e30d&token=1295868952&lang=zh_CN#rd
边栏推荐
- Network security - Cookie injection
- 如何在树莓派上搭建运行 WordPress
- Explain flex layout in detail
- 使用Activiti创建数据库表报错,
- Statistical table of competition time and host school information of 2022 national vocational college skills competition (the second batch)
- 数据类型二进制字符串类型
- rhcsa第六次笔记
- Easycvr platform security scanning prompt go pprof debugging information leakage solution
- How to configure webrtc protocol for low latency playback on easycvr platform v2.5.0 and above?
- 网络安全——WAR后门部署
猜你喜欢

Explain the edge cloud in simple terms | 2. architecture

Simulate the implementation of the library function memcpy-- copy memory blocks. Understand memory overlap and accurate replication in detail

Group intelligence decision-making in an open environment: concepts, challenges and leading technologies

网络安全——使用Evil Maid物理访问安全漏洞进行渗透

JS execution mechanism

为什么函数式接口 Comparator 中有 “两个抽象方法”?
Network security - filtering bypass injection

From cloud native to intelligent, in-depth interpretation of the industry's first "best practice map of live video technology"

Network security - war backdoor deployment
网络安全——WAR后门部署
随机推荐
Common OJ questions of stack and queue
网络安全——文件上传渗透测试
XSS white list
Sringboot-plugin-framework 实现可插拔插件服务
Flex layout
R language uses the sum function of epidisplay package to calculate the descriptive statistical summary information of the specified variables in dataframe under different grouping variables, visualiz
网络安全——Cookie注入
CSP2021 T3 回文
三层交换机配置MSTP协议详解【华为eNSP实验】
R语言使用epiDisplay包的dotplot函数通过点图的形式可视化不同区间数据点的频率、使用by参数指定分组参数可视化不同分组的点图分布、使用cex.Y.axis参数指定Y轴分组标签文本的大小
WSDM 22 | graph recommendation based on hyperbolic geometry
MPLS中的包交换和标签交换
The latest and complete Flink series tutorials in 2021_ Preliminary exploration of Flink principle and flow batch integration API (II. V) V2
How to quickly wrap lines in Excel table
Statistical table of competition time and host school information of 2022 national vocational college skills competition (the second batch)
Simulate the implementation of the library function memcpy-- copy memory blocks. Understand memory overlap and accurate replication in detail
Error reported when using activiti to create a database table
网络安全——Web信息收集
How to verify the domain name after applying for SSL digital certificate?
Research and progress of traffic situation awareness based on social media data enhancement