当前位置:网站首页>Basic skills of x64dbg
Basic skills of x64dbg
2022-06-23 04:21:00 【Muyi Lin】
x64dbg Basic skills
Recently used DBG More , So I checked some materials to learn and organize them into adaptive notes .
This article is excerpted from :x64dbg A collection of tips and practical plug-ins
Official website : https://x64dbg.com/
DBG Root directory contents
DBG The extracted root directory is shown in the following figure , double-click x96dbg, Three pop-up windows appear , Will generate x96dbg.ini file , It records 32 Bit and 64 position dbg Program path .
When you need to move the entire program folder to another path , Better take this ini Delete , Double click it again to generate . When you need to add it to the send to menu , It is also recommended to add x96dbg, It will automatically choose to use x32 still x64dbg open .

Option is set
appearance
- Font size adjustment Options —— appearance —— typeface —— The number on the far right ( r )( For my personal use 12)
- Topic selection Options —— The theme —— Choose what you like ( l ).

event :
Check the entry breakpoint to pause at the main module entry point for the first time , Others shall be determined according to the commissioning conditions .
engine :
Keep the default , One thing to note is that Disable data compression and Save the data in the application directory , The data refers to the commissioning related data , The default is saved in the debugger db Under the folder , therefore db There are many data files under the folder , Clean up in time when necessary .
Debug engine options GleeBug, According to the author's previous blog content, the tracking speed will be faster than the default Titan Much faster , But I tried and felt nothing .
abnormal :
I don't understand , Keep default 
Disassembly : Only in CIP Show automatic notes at —— The interface will be cleaner after checking , There should be some automatic annotation , Make your own choices
Maximum length of module name —— Default -1 Don't limit , If you encounter a long file name , The interface will look bad when debugging ,OD The limit length of is 8, Make your own choice .
Add... Before the value 0x Prefix —— x64dbg Default in 16 Hexadecimal display value ( No display 0x), If you need to represent decimal , You can add some in front , Add a dot to the input in the assembly 10 Hexadecimal needs to be set XEDparse engine .
Of course, if you directly check the change option, you can directly enter 10 Base number is enough .
The graphical interface : Graphics zoom mode —— This means x64dbg Flow chart function Is scaling supported , When checked, the operation experience of the flowchart will be slightly similar to IDA.
miscellaneous : You can change the search engine to Baidu :https://www.baidu.com/[email protected] When encountering an unknown function, select , Right click , Symbol name help , Direct inquiry .

Using skills
Favorite parameters :( Parameters are added after the path to select or replace the analysis of the current program )%PID%:
If you add... On the command line of the tool %PID%, It will be debugged by the object ( If no debugging or 0 ) Of ( Decimal system ) PID Replace .
%DEBUGGEE%:
If you add %DEBUGGEE%, Then it will add a debug object ( No quotation marks ) The complete path to .
%MODULE%:
If you add %MODULE%, Will be added to the current disassembly module ( No quotation marks ) Full path to .
%-????-%:
If you add %-???-%, It will execute wherever you put it ??? String format . Example :%-{cip}-% Will use cip Hexadecimal value of .
Application, for example, :
“D:\ Reverse Mini toolset \010Editor\010Editor.exe”%DEBUGGEE% Will add my 010Editor Tools ( Remember to double quote the path ), Then put your favorites —— Select... In the collection toolbox . Click on 010Editor.exe Icon , The module currently being debugged will be started and analyzed .
But if you don't add parameters %DEBUGGEE% Just simply open 010Editor, There is no analysis of the current program .
flow chart :
Press... In the Disassembly window G Key to switch to the flowchart , Press again G Come back . It is recommended to match the drawing zoom mode setting , It can be used Ctrl+ Scroll wheel to zoom .
Right click to disengage , Can be used in conjunction with the Disassembly window , And hotkeys G In the process, you can also go to... In the Disassembly window , So we can look at it in relation .
Ctrl+G Jump to
You can input API, Will automatically complete . The default is input VA, If you want to enter RVA It needs to be like this : :$RVA( Note that this colon should be accompanied by )
give an example :
Input :$0 Jump to the base address 
If necessary, enter FOA It can be like this :
:#FOA Or press Ctrl+Shift+G Input again FOA, But this requires a correspondence of file bytecode information , There is no demand here for the time being .
Press hotkey H Enter highlight mode , Highlight all the same content :
At this point, click the content to be highlighted to highlight , Press again H, Click the blank space to cancel .( You can also set highlighting to always be on , But there is the problem of delay )
database :
Met a few times x64dbg Data loss , Wrote a lot of notes and then disappeared , Don't panic in this situation , Because every time you close x64dbg When saving automatically , Will back up the last data file (.bak), At this time, you can try to click restore backup database .
x64dbg Calculator :
Personally, I think it is easier to use than the system's own calculator , You can calculate while debugging ( Modeless + Roof placement ), Don't cut around , Support x64dbg Various expressions of .
Right click —— Display command prompt :
The explanation corresponding to the assembly instruction will be displayed , It's very helpful for beginners , There is a Chinese version of Wang Su , These help texts are also completely translated into Chinese .( Self search )

File menu —— Change the command line
It can support debugging with parameters .( I don't understand what it is for )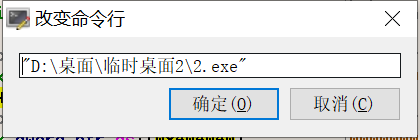
Copy data in various formats :
Select the part you want —— Right click binary —— edit —— Copy the data 
In a few cases 64 Bit system uses x64dbg debugging 32 Bit program interface stuck problem
This question is very metaphysical , I met , After searching the Internet, there was also a friend who met , There are very few students around me , Here's the solution .
x32dbg.exe —— Right click Properties —— Compatibility —— Modulation Windows 7 ( The blogger who encountered the same problem solved it like this )
But after I set it like this, I still got stuck , Later, he pretended to be called xAnalyzer Plug in for , Again .( In my case, this plug-in and compatibility settings are indispensable , Or you'll get stuck , It's wonderful , The system is still the same after reinstallation , Make a record here , To prevent someone from encountering )
ESP hardware breakpoint
Right click in the blank space of the register window 
automatic tracking :
Right click —— Tracking record —— Start running trace —— Click on the menu bar track (N)—— Stepping \ Step until the conditions are met .
Set it like this in the pause condition or command :eip/rip== Address to be tracked , Then you can view the tracking results in the tracking window .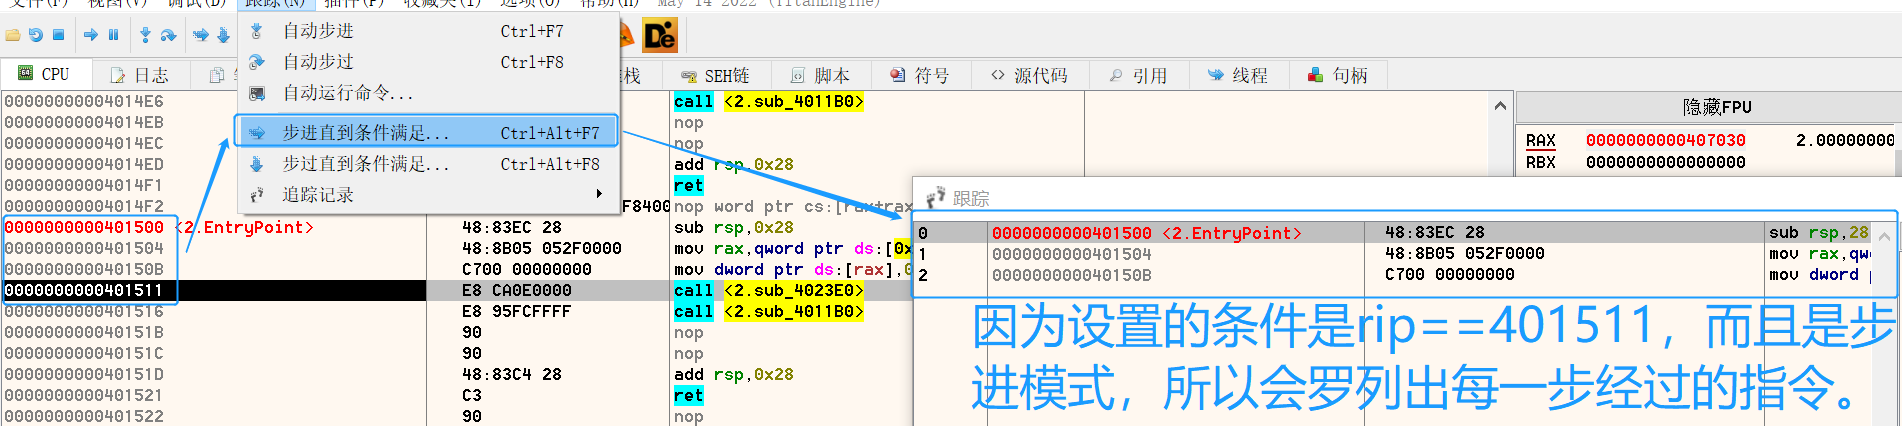
Switch XX:
Switch breakpoints 、 Toggle Bookmarks , This kind of naming brought me some troubles and misunderstandings at first , Later, I found that switching means Set up / Cancel settings . Click to set , Click again to cancel the setting , So it is named switch .
By the way ,x64dbg Search results for , Memory window , Tracking results , Almost all places with addresses , All support direct F2 Set breakpoint's , You can make more use of it to improve efficiency .
Plug in recommendations :
Introduce some regular plug-ins , Plug in on release\x32 perhaps x64\plugins Under the table of contents , With .dp32 or .dp64 ending )
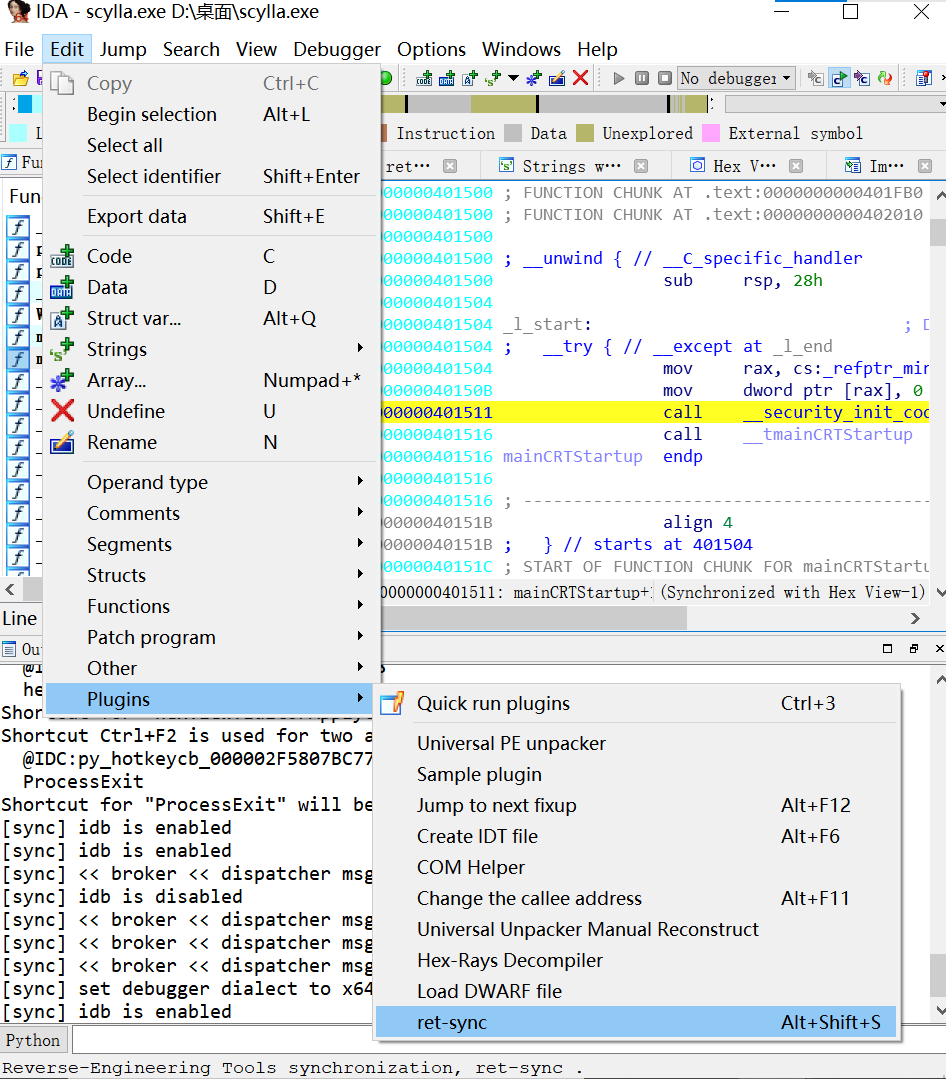
Scylla( Shelling and import table repair ):
Built-in plug-ins , I think it's better than OD+ImpREC More convenient and quick
Common shelling process :
x64dbg Stop at the address that needs to be shelled , Click on Scylla Icon to start , Will automatically set for you IAT info Inside OEP Is the current address , Click on dump.
Fix import table :
Click on IAT Autosearch, It's possible to hint —— Advanced search results are different from normal search results , Whether to use advanced search results . Generally, I choose , And then, I'll go on Get Imports, Automatically get the function that needs to be repaired .
( Sometimes we will encounter the situation that advanced search fails to find , At this time, you can try No and then order Get Imports)
Click after confirming that the result is correct Fix Dump, Select just Dump Out of the file , The result is SCY The repaired file at the end .
.
.
xAnalyzer( Code analysis AIDS )
Plug in project address : https://github.com/ThunderCls/xAnalyzer
The plug-in's contribution to the debugger API Function call to detect , Automatically add function definitions , Parameters and data types and other supplementary information , After installation, you can x64dbg And OllyDbg The use experience of is closer to .
The effect is as shown in the picture , You can set auto analysis in the plug-in menu (Automatic Analysis) open . Personally, I don't like plug-ins to add many comments automatically , It makes the page look messy , Therefore, when analysis is needed, you can use the right-click menu to make it analyze the current function .

.
.
SwissArmyKnife( Import Map file )
Project address : https://github.com/Nukem9/SwissArmyKnife
I didn't use it myself map File analysis , The original words of the original blog are analysis C When using the program IDA Generate MAP file , Then use this plug-in to load . analysis delphin The program recommends Interactive Delphi Reconstructor First analysis , generating MAP For documents , There are other procedures as well .MAP Files can greatly speed up your analysis , Reduce the analysis of some known library functions .
.
.
x64dbg_tol( Chinese search support )
Project address :https://bbs.pediy.com/thread-261942-1.htm
Required plug-ins , Although the official version began to improve the support for Chinese , But they also said on their blog , It may not be all , It is recommended to install the plug-in by yourself . I tested it myself , Um. , They're right . With this plug-in, you can find Chinese strings that you could not find before .
.
.
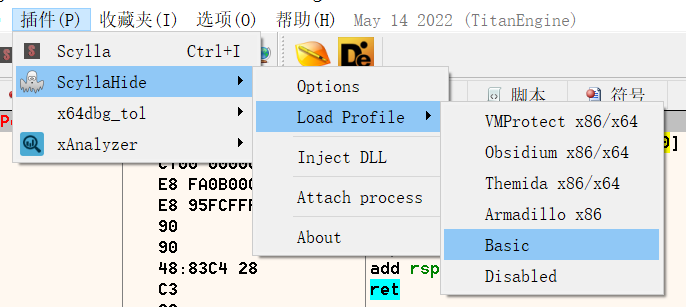
ScyllaHide( Reverse debugging )
Project address : https://github.com/x64dbg/ScyllaHide
It's easy to use , Plug in menu ——Options——Loaded You can choose your own bypass scheme in ( After General de debugging, you can use Basic Even use your own debugging —— senior —— Hide debugger )
Take a simple example IsDebuggerPresent Anti debugging :

.
.
hear VM3.x You can use the built-in VM The plan goes straight through , Instead, OD Of StrongOD Plug ins don't work .( At present, I haven't reappeared myself )
.
.
Ret-Sync (IDA x64dbg\OD Synchronous debugging plug-in )
Project address : https://github.com/bootleg/ret-sync
How to use : https://bbs.pediy.com/thread-252634.htm
It can make IDA and x64dbg\OD\windbg Conduct synchronous debugging , Support in IDA Step directly in 、 Lower breakpoint 、 Operation, etc ,x64dbg Will be with IDA Keep in sync , An artifact to improve your debugging efficiency , About installation 、 For instructions, please refer to the official github explain ( A more detailed ) And watching snow .
I reappeared myself and found that I didn't need it for the time being , Because it can only IDA7.0, This version is too old , And then you have to x64dbg I don't have this requirement for operation analysis yet , So let's not delve into it .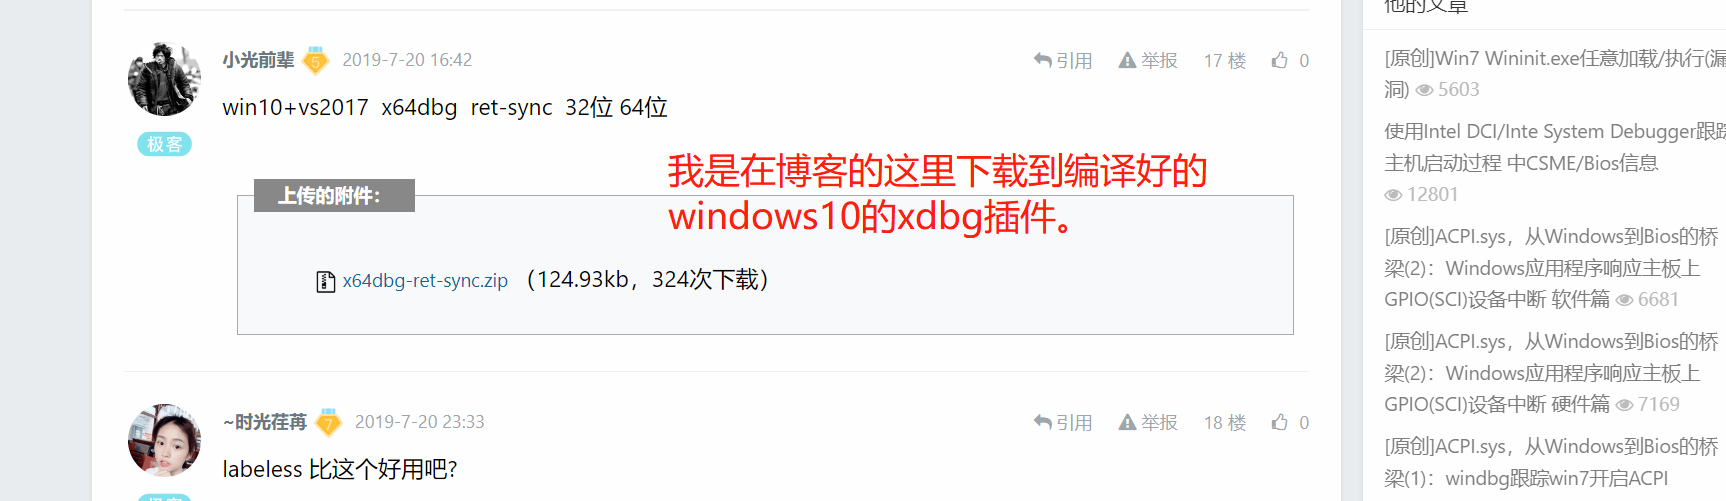


.
.
E-ApiBreak( Common breakpoint settings )
Project address :https://www.52pojie.cn/forum.php?mod=viewthread&tid=1384349
OD In common use ApiBreak plug-in unit , Now? x32dbg There are also , however x64dbg So far no , It is a tool for setting breakpoints in the global context .
.
.
E-Debug( It is necessary to analyze easy language programs )
Project address : https://www.52pojie.cn/forum.php?mod=viewthread&tid=1374290
The original author : githubhttps://github.com/fjqisba/E-debug-plus
This can double the efficiency of analyzing easy language ,OD The plug-in is available on . Now someone transplanted it to x32dbg 了 , After opening, the easy language library functions will be automatically recognized and commented .( I don't have one myself 32 Easy language program , So there is no way to reproduce )
Before analysis :
( Images from :https://www.52pojie.cn/forum.php?mod=viewthread&tid=1374290)
After analysis :
( Images from :https://www.52pojie.cn/forum.php?mod=viewthread&tid=1374290)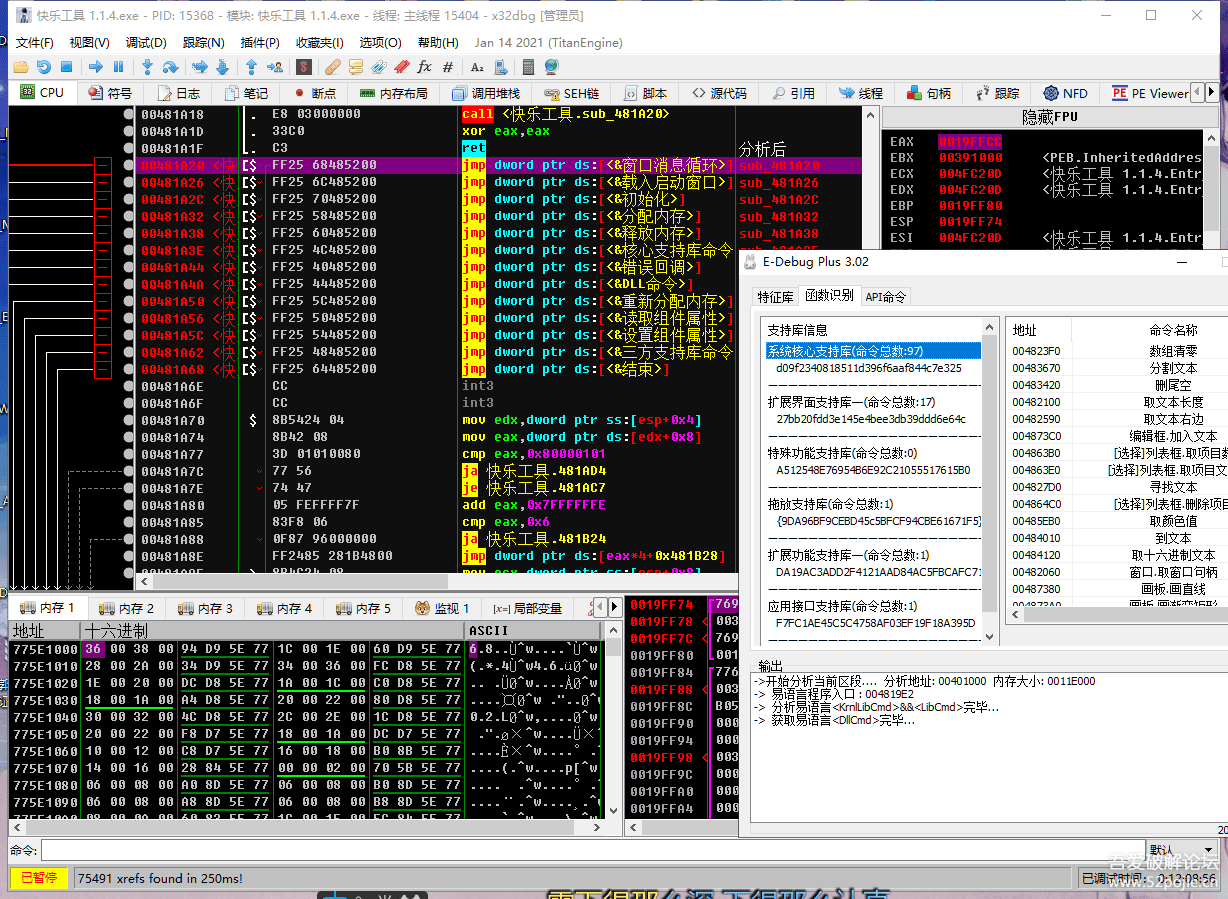

.
.
HotSpots( Used to find event breakpoints )
Project address : https://github.com/ThunderCls/xHotSpots
Select the corresponding language from the drop-down box , Press the button to break the button event handler .( I've never used , So it doesn't happen again , The following picture is also from the original blog )
.
.
BaymaxTools( Feature extraction and search )
Project address : https://github.com/sicaril/BaymaxTools
Quick extraction of selected area feature code and feature code search function ( Of course you can use it Ctrl+B Search for a signature )
边栏推荐
- P1347 sorting (TOPO)
- AI video cloud vs narrowband HD, who is the favorite in the video Era
- mysql存储引擎之Myisam和Innodb的区别
- [tcapulusdb knowledge base] [list table] example code for deleting the data at the specified location in the list
- [advanced binary tree] AVLTree - balanced binary search tree
- Insert sort directly
- 选择排序法
- 基于FPGA的VGA协议实现
- Section 2: spingboot unit test
- MySQL common instructions
猜你喜欢


随机推荐
Ideal car × Oceanbase: when new forces of car building meet new forces of database
Similar to RZ / SZ, trzsz supporting TMUX has released a new version
电商如何借助小程序发力
Two ways to improve the writing efficiency of hard disk storage data
AI video cloud vs narrowband HD, who is the favorite in the video Era
华为联机对战服务玩家快速匹配后,不同玩家收到的同一房间内玩家列表不同
AI video cloud: a good wife in the era of we media
How to process large volume xlsx/csv/txt files?
A summary of PostgreSQL data types. All the people are here
The first batch of job hunting after 00: don't misread their "different"
[Zeng shuge's laser slam notes] gmapping filter based slam
Getting started with tensorflow
[tcapulusdb knowledge base] [list table] sample code for inserting data into the specified position in the list
Weekly Postgres world news 2022w02
虫子 日期类 下 太子语言
HAProxy的编译安装及全局配置段说明
如何处理大体积 XLSX/CSV/TXT 文件?
Three ways to export excel from pages
京东云分布式数据库StarDB荣获中国信通院 “稳定性实践先锋”
在线文本过滤小于指定长度工具