当前位置:网站首页>How to do factor analysis? Why should data be standardized?
How to do factor analysis? Why should data be standardized?
2022-06-25 08:16:00 【spssau】
Data analysis , It doesn't start directly from the analysis , When you get a copy of the data you want to analyze , It is often necessary to carry out a basic work first - Data processing . General operation method of data processing , just as SPSSAU【 Data processing 】 These processing methods provided in the plate .

And the 【 Generating variables 】 Method includes many methods to reprocess data variables :

The standardized processing of data , This is what needs to be done before a lot of data analysis :
- In some analyses, such as principal component analysis 、 Factor analysis 、 Linear regression analysis and so on all hope that the data can be standardized .
- At the same time, some comprehensive evaluation methods will require more data processing , such as Centralization etc. , Centralization means :X- Average .
- There are also some management methods : For example, mediation 、 The regulating effect shall be standardized .
If not standardized , There may be errors in the later analysis results .
The main purpose of data standardization is to eliminate the influence of dimension and value range differences between indicators . What is the dimension of eliminating indicators ? In general , The data we have collected has units , Such as collecting a piece of personal information , It includes two indicators: height and weight , Height has a unit cm, There are units of weight kg, The dimension of eliminating indicators is the unit of eliminating them , When the magnitude of different indicators varies greatly , It is necessary to eliminate dimensions , otherwise , The result of data analysis may be determined by the index value with large magnitude , And the indicators with small magnitude are ignored , So eliminate dimensions , Make it all data without unit , For later analysis .
For example, the following case , It is necessary to make factor analysis on the comprehensive development of provinces and cities in China , There are six indicators in the table .

Data like this , Some indicators are extremely large , Some indicators are very small , such as “ Number of colleges and universities ” and “ Per capita GDP” These two indicators , So before factor analysis , It is necessary to standardize the data of these six indicator variables .
In the process of data standardization , One of the most widely used standardized methods is z-score Standardization , This article shares z-score The principle and practice of standardization , And how to do factor analysis .
One 、 Data Z-score Standardization
(1)Z-score Standardization principle
z-score Standardization is based on the mean value of the original data μ And standard deviation σ On going , Through the following conversion formula , The original value can be converted into a uniform mean value of 0, The standard deviation is 1 The data of .
z-score Standardized conversion formula :

The significance of the newly obtained standardized data is “ How many standard deviations are there relative to the mean distance of a given data ”, Data above the mean will get a positive normalized score , Those below the mean get a negative normalized score . After standardization, all the data will be unified , There won't be very large data, such as 10000, And some data are very small, such as 10. Here's the picture :

apply :z-score The standardized method is applicable to the case where the maximum and minimum values of a variable are unknown , Or there are outliers beyond the value range .
(2) Use SPSSAU Standardize data
In the actual analysis operation , Data standardization is very simple , Here, we use the above case data to demonstrate how to do .
1、 Start by opening SPSSAU Website , The uploaded data is shown in the figure below :

2、 Yes 6 The index values to measure the comprehensive development of provinces and cities are standardized , stay SPSSAU Select... On the right side of the page 【 Data processing 】 In the section 【 Generating variables 】 Button .

3、 Then choose Z Standardization method , Select the to be standardized 6 Indicators , Click on 【 Confirm the handling 】 that will do .

4、 Processing results
SPSSAU The system automatically generates new standardized indicator variables , Original index value still exists .

At this time, you can also view the specific standardized values , You can see that all the data is compressed into a specific range :

This completes the data standardization processing , Then we can use the standardized data for factor analysis .
Two 、 Factor analysis
SPSSAU Provides ready-made factor analysis methods , It can be done quickly , The operation is as follows :
(1) Operation steps
stay SPSSAU Select... On the left side of the page 【 Advanced method 】 Medium 【 factor 】 Button , After standardization 6 Drag indicator variables to the analysis box on the right side of the page , Select the number of factors according to the actual situation of the study , Choose here 3 individual , Click on 【 To analyze 】 The result of factor analysis can be obtained .

(2) Output results
SPSSAU Co output 4 Result tables , Automatic generation 2 Visual graphics , They are as follows :
1、KMO and Bartlett The test of :

Factor analysis explores that quantitative data can be condensed into several aspects ( factor ), Every aspect ( factor ) Corresponding to the question item ;
First of all : analysis KMO value ; If this value is higher than 0.8, So it is very suitable for factor analysis ; If this value is between 0.7~0.8 Between , It shows that it is more suitable for factor analysis ; If this value is between 0.6~0.7, It means that factor analysis can be carried out ; If this value is less than 0.6, It indicates that factor analysis is not suitable ;
second : If Bartlett Inspection correspondence p Less than 0.05 It also shows that it is suitable for factor analysis ;
Third : If there are only two analysis items , be KMO In any case 0.5.
2、 Variance interpretation rate table

3、 Load factor table after rotation

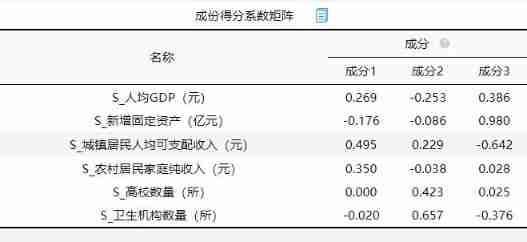
4、 Component score coefficient matrix
5、 Gravel map

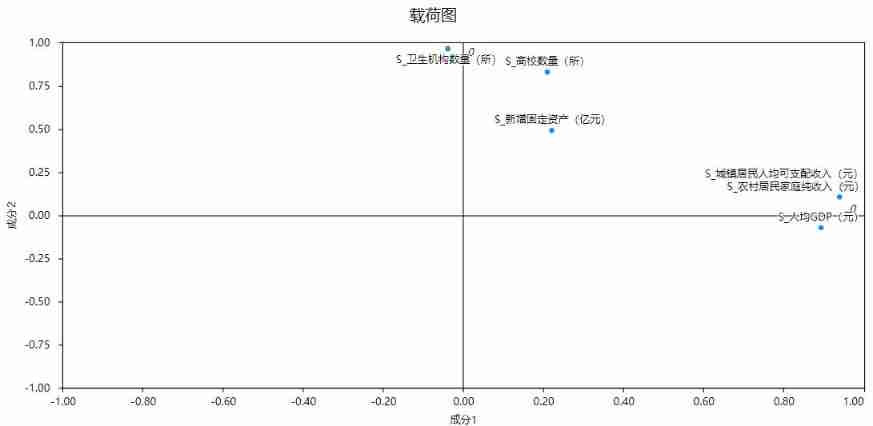
6、 Load diagram
7、 Linear combination coefficient and weight results

3、 ... and 、 summary
All in all , Before doing factor analysis , Generally, data standardization is required first , Eliminate the dimensional impact of data indicators , Data standardization and factor analysis in SPSSAU On-line SPSS Data analysis tools have been fooled , Just drag and drop to complete , It is more convenient for the statistics entrants .
边栏推荐
- Electronics: Lesson 010 - Experiment 8: relay oscillator
- 电子学:第008课——实验 6:非常简单的开关
- 417 sequence traversal of binary tree 1 (102. sequence traversal of binary tree, 107. level traversal of binary tree II, 199. right view of binary tree, 637. layer average of binary tree)
- RMQ interval maximum subscript query, interval maximum
- 电子学:第009课——实验 7:研究继电器
- c#搭建ftp服务器并实现文件上传和下载
- Cloud computing exam version 1 0
- Electronics: Lesson 009 - Experiment 7: study relays
- TCP 加速小记
- Electronics: Lesson 014 - Experiment 15: intrusion alarm (Part I)
猜你喜欢

TCP stuff

Remove headers from some pages in a word document

唐老师讲运算放大器(第七讲)——运放的应用

Ph中和过程建模

2022年毕业生求职找工作青睐哪个行业?

Wechat applet opening customer service message function development

Establish open data set standards and enable AI engineering implementation

417 sequence traversal of binary tree 1 (102. sequence traversal of binary tree, 107. level traversal of binary tree II, 199. right view of binary tree, 637. layer average of binary tree)

Electronics: Lesson 010 - Experiment 9: time and capacitors

What is SKU and SPU? What is the difference between SKU and SPU
随机推荐
剑指offer刷题(中等等级)
Deep learning series 48:deepfaker
初体验完全托管型图数据库 Amazon Neptune
Pycharm的奇葩设定:取消注释后立马复制会带上#
Est - il sûr d'ouvrir un compte d'actions maintenant via le lien d'ouverture de compte coiffé?
c#搭建ftp服务器并实现文件上传和下载
Common action types
RMQ interval maximum subscript query, interval maximum
STM32CubeMX 学习(5)输入捕获实验
洛谷P5994 [PA2014]Kuglarz(异或思维+MST)
[red flag Cup] Supplementary questions
不怕百战失利,就怕灰心丧气
电子学:第010课——实验 8:继电振荡器
Electronics: Lesson 012 - Experiment 13: barbecue LED
Go语言学习教程(十三)
Luogu p1073 [noip2009 improvement group] optimal trade (layered diagram + shortest path)
Basic record of getting started with PHP
Sword finger offer (medium level)
Luogu p3313 [sdoi2014] travel (tree chain + edge weight transfer point weight)
Electronics: Lesson 012 - Experiment 11: light and sound