当前位置:网站首页>Postgresql_ Optimize SQL based on execution plan
Postgresql_ Optimize SQL based on execution plan
2022-06-23 17:32:00 【User 7353950】
Execution plan path selection
postgres During the query planning process , Different execution schemes of query request are expressed by establishing different paths , After generating many qualified paths , Choose the path with the least cost , Turn it into a plan , Pass it to the actuator to execute , The core work of the planner is to generate multiple paths , And then find the best one .
Cost assessment
The basis for evaluating the path is to use the system table pg_statistic The cost of different paths estimated by the statistics in (cost),PostgreSQL How to estimate the cost of a plan : Estimate the cost of each node in the plan based on statistical information .PostgreSQL Will analyze each table to get a sample of statistical information ( This is usually done by autovacuum The daemons execute periodically analyze, To collect these statistics , Then save to pg_statistic and pg_class Inside ).
The parameters used to estimate the cost postgresql.conf
# - Planner Cost Constants -#seq_page_cost = 1.0			# measured on an arbitrary scale   The cost of a single page in sequential disk scanning
#random_page_cost = 4.0			# same scale as above 	 Single page read overhead for random disk access
#cpu_tuple_cost = 0.01			# same scale as above cpu The cost of processing each line
#cpu_index_tuple_cost = 0.005		# same scale as above cpu The cost of processing each index row
#cpu_operator_cost = 0.0025		# same scale as above cpu The overhead of handling each operator or function call
#parallel_tuple_cost = 0.1		# same scale as above  Computing the cost of parallel processing , If the cost is higher than nonparallel , Parallel processing is not turned on .
#parallel_setup_cost = 1000.0	# same scale as above
#min_parallel_relation_size = MB
#effective_cache_size = GB  Again, the effective size of the file system kernel buffer available in the index scan

You can also use show all Way to view The choice of path
-- View table information db_jcxxglpt=# \d t_jcxxgl_tjaj               Table "db_jcxx.t_jcxxgl_tjaj"    Column    |              Type              | Modifiers
--------------+--------------------------------+-----------
 c_bh         | character()                  | not null
 c_xzdm       | character varying()         |
 c_jgid       | character()                  |
 c_ajbm       | character()                  | ...
Indexes:
    "t_jcxxgl_tjaj_pkey" PRIMARY KEY, btree (c_bh)
    "idx_ttjaj_cah" btree (c_ah)
    "idx_ttjaj_dslrq" btree (d_slrq)

 First update the statistics vacuum analyze t_jcxxgl_tjaj, In many cases, inaccurate statistical information may lead to abnormal implementation plan -- Implementation plan , Full table scan db_jcxxglpt=# explain (analyze,verbose,costs,buffers,timing)select c_bh,c_xzdm,c_jgid,c_ajbm from t_jcxxgl_tjaj where d_slrq >='2018-03-18';
                                                   QUERY PLAN
------------------------------------------------------------------------------------------------------------
 Seq Scan on db_jcxx.t_jcxxgl_tjaj  (cost=0.00..9.76 rows= width=) (actual time=1.031..1.055 rows= loops=)
   Output: c_bh, c_xzdm, c_jgid, c_ajbm   Filter: (t_jcxxgl_tjaj.d_slrq >= '2018-03-18'::date)   Rows Removed by Filter:
   Buffers: shared hit=
 Planning time: 6.579 ms
 Execution time: 1.163 ms
( rows)-- Implementation plan , Turn off full table scan db_jcxxglpt=# set session enable_seqscan = off;SETdb_jcxxglpt=# explain (analyze,verbose,costs,buffers,timing)select c_bh,c_xzdm,c_jgid,c_ajbm from t_jcxxgl_tjaj where d_slrq >='2018-03-18';
                                                               QUERY PLAN
------------------------------------------------------------------------------------------------------------
 Index Scan using idx_ttjaj_dslrq on db_jcxx.t_jcxxgl_tjaj  (cost=0.14..13.90 rows= width=) (actual time=0.012..0.026 rows= loops=)
   Output: c_bh, c_xzdm, c_jgid, c_ajbm
   Index Cond: (t_jcxxgl_tjaj.d_slrq >= '2018-03-18'::date)
   Buffers: shared hit=
 Planning time: 0.309 ms
 Execution time: 0.063 ms
( rows)

d_slrq It has btree Indexes , But looking at the execution plan is not indexed , Why is that ?
 Cost calculation :
 The estimation of a path consists of three parts : Start up costs (startup cost), Total cost (totalcost), Sort the execution results (pathkeys)
 The cost estimation formula : Total cost = Start up costs +I/O cost +CPU cost (cost=S+P+W*T)
P: The number of pages to visit when executing , Reflecting the disk's I/O frequency
T: Represents the number of tuples to be accessed at execution time , Reflects cpu expenses
W: Represents a disk I/O The price and CPU The weight factor of overhead
 Statistics : Part of the statistics is the total number of entries in each table and index , And the number of disk blocks per table and index . This information is stored in pg_class Tabular reltuples and relpages In the column . We can look up relevant information in this way :-- View statistics db_jcxxglpt=# select relpages,reltuples from pg_class where relname ='t_jcxxgl_tjaj';
 relpages | reltuples
----------+-----------
         |       ( row)

total_cost = (seq_page_cost)*( Total number of pages on disk )+0.01(cpu_tuple_cost)*( The total number of records in the table )+0.0025(cpu_operation_cost)*( The total number of records in the table )=9.7625 You can see the index cost=13.90 More than a full table scan cost=9.76 Be big . In the case of small tables , Full table scanning is more effective than index scanning , index scan It's going to happen at least twice I/O, One is to read the index block , One is to read the data block .seq_scan Source code
/*
 * cost_seqscan
 *	  Determines and returns the cost of scanning a relation sequentially.
 *
 * 'baserel' is the relation to be scanned
 * 'param_info' is the ParamPathInfo if this is a parameterized path, else NULL
 */void
cost_seqscan(Path *path, PlannerInfo *root,
			 RelOptInfo *baserel, ParamPathInfo *param_info)
{
	Cost		startup_cost = ;
	Cost		cpu_run_cost;
	Cost		disk_run_cost;	double		spc_seq_page_cost;
	QualCost	qpqual_cost;
	Cost		cpu_per_tuple;	/* Should only be applied to base relations */
	Assert(baserel->relid > );
	Assert(baserel->rtekind == RTE_RELATION);	/* Mark the path with the correct row estimate */
	if (param_info)
		path->rows = param_info->ppi_rows;	else
		path->rows = baserel->rows;

	if (!enable_seqscan)
		startup_cost += disable_cost;	/* fetch estimated page cost for tablespace containing table */
	get_tablespace_page_costs(baserel->reltablespace, NULL,&spc_seq_page_cost);	/*
	 * disk costs
	 */
	disk_run_cost = spc_seq_page_cost * baserel->pages;	/* CPU costs */
	get_restriction_qual_cost(root, baserel, param_info, &qpqual_cost);

	startup_cost += qpqual_cost.startup;
	cpu_per_tuple = cpu_tuple_cost + qpqual_cost.per_tuple;
	cpu_run_cost = cpu_per_tuple * baserel->tuples;	/* tlist eval costs are paid per output row, not per tuple scanned */
	startup_cost += path->pathtarget->cost.startup;
	cpu_run_cost += path->pathtarget->cost.per_tuple * path->rows;	/* Adjust costing for parallelism, if used. */
	if (path->parallel_workers > )
	{		double		parallel_divisor = get_parallel_divisor(path);		/* The CPU cost is divided among all the workers. */
		cpu_run_cost /= parallel_divisor;		/*
		 * It may be possible to amortize some of the I/O cost, but probably
		 * not very much, because most operating systems already do aggressive
		 * prefetching.  For now, we assume that the disk run cost can't be
		 * amortized at all.
		 */

		/*
		 * In the case of a parallel plan, the row count needs to represent
		 * the number of tuples processed per worker.
		 */
		path->rows = clamp_row_est(path->rows / parallel_divisor);
	}

	path->startup_cost = startup_cost;
	path->total_cost = startup_cost + cpu_run_cost + disk_run_cost;
}One SQL Optimization examples
 slow SQL:select c_ajbh, c_ah, c_cbfy, c_cbrxm, d_larq, d_jarq, n_dbjg, c_yqly from db_zxzhld.t_zhld_db dbxx join db_zxzhld.t_zhld_ajdbxx dbaj
	on dbxx.c_bh = dbaj.c_dbbh where dbxx.n_valid= and dbxx.n_state in (,,) and dbxx.c_dbztbh='1003'
 	and dbaj.c_zblx='1003' and dbaj.c_dbfy='0' and dbaj.c_gy = '2550'
	and c_ajbh in (select distinct c_ajbh from db_zxzhld.t_zhld_zbajxx where n_dbzt =  and c_zblx = '1003' and c_gy = '2550' )
	order by d_larq asc, c_ajbh asc limit  offset  slow sql Time consuming :s
 Let's go through this first sql What is it 、 First dbxx and dbaj One of the join Connect and dbaj.c_ajbh To be included in zbaj Inside the watch , Sort it out , Got records 、 That's about it .
Sql One drawback is that I don't know which table the query field is from 、 It is suggested to add table alias . Field .
 View the sql The amount of data in the table :
db_zxzhld.t_zhld_db	:db_zxzhld.t_zhld_ajdbxx	:db_zxzhld.t_zhld_zbajxx :
		 Implementation plan : Limit  (cost=36328.67..36328.68 rows= width=) (actual time=88957.677..88957.729 rows= loops=)   ->  Sort  (cost=36328.67..36328.68 rows= width=) (actual time=88957.653..88957.672 rows= loops=)         Sort Key: dbaj.d_larq, dbaj.c_ajbh         Sort Method: top-N heapsort  Memory: kB         ->  Nested Loop Semi Join  (cost=17099.76..36328.66 rows= width=) (actual time=277.794..88932.662 rows= loops=)               Join Filter: ((dbaj.c_ajbh)::text = (t_zhld_zbajxx.c_ajbh)::text)               Rows Removed by Join Filter:                ->  Nested Loop  (cost=0.00..19200.59 rows= width=) (actual time=199.141..601.845 rows= loops=)                     Join Filter: (dbxx.c_bh = dbaj.c_dbbh)                     Rows Removed by Join Filter:                      ->  Seq Scan on t_zhld_ajdbxx dbaj  (cost=0.00..19117.70 rows= width=) (actual time=198.871..266.182 rows= loops=)                           Filter: ((n_valid = ) AND ((c_zblx)::text = '1003'::text) AND ((c_dbfy)::text = '0'::text) AND ((c_gy)::text = '2550'::text))                           Rows Removed by Filter:                      ->  Materialize  (cost=0.00..66.48 rows= width=) (actual time=0.001..0.017 rows= loops=)                           ->  Seq Scan on t_zhld_db dbxx  (cost=0.00..66.45 rows= width=) (actual time=0.044..0.722 rows= loops=)                                 Filter: ((n_valid = ) AND ((c_dbztbh)::text = '1003'::text) AND (n_state = ANY ('{1,2,3}'::integer[])))                                 Rows Removed by Filter:                ->  Materialize  (cost=17099.76..17117.46 rows= width=) (actual time=0.006..4.890 rows= loops=)                     ->  HashAggregate  (cost=17099.76..17106.84 rows= width=) (actual time=44.011..54.924 rows= loops=)                           Group Key: t_zhld_zbajxx.c_ajbh                           ->  Bitmap Heap Scan on t_zhld_zbajxx  (cost=163.36..17097.99 rows= width=) (actual time=5.218..30.278 rows= loops=)                                 Recheck Cond: ((n_dbzt = ) AND ((c_zblx)::text = '1003'::text))                                 Filter: ((c_gy)::text = '2550'::text)                                 Rows Removed by Filter:                                  Heap Blocks: exact=                                 ->  Bitmap Index Scan on i_tzhldzbajxx_zblx_dbzt  (cost=0.00..163.19 rows= width=) (actual time=5.011..5.011 rows= loops=)                                       Index Cond: ((n_dbzt = ) AND ((c_zblx)::text = '1003'::text)) Planning time: 1.258 ms Execution time: 88958.029 ms
 Implementation plan interpretation :: The first -> That's ok , Through the index i_tzhldzbajxx_zblx_dbzt Filter tables t_zhld_zbajxx The data of , And then according to the filter conditions (c_gy)::text = '2550'::text Filter the final returned data : The first -> That's ok , Filter according to conditions t_zhld_db The data table , Finally, pieces of data are returned : The first -> That's ok , Counter table t_zhld_zbajxx do group by The operation of : The first -> That's ok , Full table scan t_zhld_ajdbxx  Finally, pieces of data are returned : Line , according to t_zhld_ajdbxx The returned result set is used as the driving table and t_zhld_db The result set ( strip ) Do nested loops ,t_zhld_db The result set of is cycled times . Then filter out the records , So in the end you'll get (*-111865) = : The first -> That's ok , According to the result set returned in rows and, we finally do Nested Loop Semi Join, The result set in line is cycled times ,(*-37018710)=:  The first -> That's ok , Sort the final records : Line ,limit Finally get records

 The most time-consuming part of the whole implementation plan is in the line Nested Loop Semi Join,actual time=277.794..88932.662,
surface db_zxzhld.t_zhld_db dbxx and db_zxzhld.t_zhld_ajdbxx All are full scan Specific optimization steps
 Look at the index page and there is no index , establish c_ajbh,c_dbbh Index of logical foreign key drop index  if exists I_T_ZHLD_AJDBXX_AJBH;create index I_T_ZHLD_AJDBXX_AJBH on T_ZHLD_AJDBXX (c_ajbh);commit;drop index  if exists I_T_ZHLD_AJDBXX_DBBH;create index I_T_ZHLD_AJDBXX_DBBH on T_ZHLD_AJDBXX (c_dbbh);commit;
 establish d_larq,c_ajbh Sort index of :drop index  if exists I_T_ZHLD_AJDBXX_m6;create index I_T_ZHLD_AJDBXX_m6 on T_ZHLD_AJDBXX (c_zblx,c_dbfy,c_gy,d_larq asc,c_ajbh asc);commit;drop index   if exists I_T_ZHLD_ZBAJXX_h3 ;create index I_T_ZHLD_ZBAJXX_h3 on db_zxzhld.t_zhld_zbajxx  (n_dbzt,c_zblx,c_gy,c_gy);commit;

 The execution plan has changed since the index was created , The original dbaj Table and dbxx Watch first nestedloop Turned into zbaj and dbaj The watch was made first nestedloop join, The total cost Also from the 36328.68 Down to 12802.87,
Limit  (cost=12802.87..12802.87 rows= width=) (actual time=4263.598..4263.648 rows= loops=)  ->  Sort  (cost=12802.87..12802.87 rows= width=) (actual time=4263.592..4263.609 rows= loops=)
        Sort Key: dbaj.d_larq, dbaj.c_ajbh
        Sort Method: top-N heapsort  Memory: kB        ->  Nested Loop  (cost=2516.05..12802.86 rows= width=) (actual time=74.240..4239.723 rows= loops=)              Join Filter: (dbaj.c_dbbh = dbxx.c_bh)              Rows Removed by Join Filter:
              ->  Nested Loop  (cost=2516.05..12736.34 rows= width=) (actual time=74.083..327.974 rows= loops=)                    ->  HashAggregate  (cost=2515.62..2522.76 rows= width=) (actual time=74.025..90.185 rows= loops=)                          Group Key: ("ANY_subquery".c_ajbh)::text                          ->  Subquery Scan on "ANY_subquery"  (cost=2499.56..2513.84 rows= width=) (actual time=28.782..59.823 rows= loops=)                                ->  HashAggregate  (cost=2499.56..2506.70 rows= width=) (actual time=28.778..39.968 rows= loops=)                                      Group Key: zbaj.c_ajbh                                      ->  Index Scan using i_t_zhld_zbajxx_h3 on t_zhld_zbajxx zbaj  (cost=0.42..2497.77 rows= width=) (actual time=0.062..15.104 rows= loops=)
                                            Index Cond: ((n_dbzt = ) AND ((c_zblx)::text = '1003'::text) AND ((c_gy)::text = '2550'::text))                    ->  Index Scan using i_t_zhld_ajdbxx_ajbh on t_zhld_ajdbxx dbaj  (cost=0.42..14.29 rows= width=) (actual time=0.015..0.021 rows= loops=)
                          Index Cond: ((c_ajbh)::text = ("ANY_subquery".c_ajbh)::text)                          Filter: (((c_zblx)::text = '1003'::text) AND ((c_dbfy)::text = '0'::text) AND ((c_gy)::text = '2550'::text))                          Rows Removed by Filter:
              ->  Seq Scan on t_zhld_db dbxx  (cost=0.00..66.45 rows= width=) (actual time=0.015..0.430 rows= loops=)                    Filter: ((n_valid = ) AND ((c_dbztbh)::text = '1003'::text) AND (n_state = ANY ('{1,2,3}'::integer[])))                    Rows Removed by Filter: Planning time: 1.075 ms
Execution time: 4263.803 msThe execution time still needs to be improved 4s Left and right still don't meet demand , And it's not used I_T_ZHLD_AJDBXX_m6 This index .
Equivalent rewriting SQL(1)
 Equivalent rewriting : Add sort criteria to db_zxzhld.t_zhld_ajdbxx Let's sort them first , And again t_zhld_db Table joins .
 After modification sql:Select dbaj.c_ajbh, dbaj.c_ah, dbaj.c_cbfy, dbaj.c_cbrxm, dbaj.d_larq, dbaj.d_jarq, dbaj.n_dbjg, dbaj.c_yqly
from (select * from db_zxzhld.t_zhld_db  where  n_valid= and n_state in (,,) and c_dbztbh='1003' )dbxx join (select * from db_zxzhld.t_zhld_ajdbxx
where n_valid= and c_zblx='1003'
 and c_dbfy='0' and c_gy = '2550' and c_ajbh  in (select distinct c_ajbh from db_zxzhld.t_zhld_zbajxx where n_dbzt =  and c_zblx = '1003' and c_gy = '2550' ) order by d_larq asc, c_ajbh asc)dbajon dbxx.c_bh = dbaj.c_dbbh
 limit  offset  Check the execution plan again :
Limit  (cost=3223.92..3231.97 rows= width=) (actual time=127.291..127.536 rows= loops=)  ->  Nested Loop  (cost=3223.92..3231.97 rows= width=) (actual time=127.285..127.496 rows= loops=)        ->  Sort  (cost=3223.64..3223.65 rows= width=) (actual time=127.210..127.225 rows= loops=)
              Sort Key: t_zhld_ajdbxx.d_larq, t_zhld_ajdbxx.c_ajbh
              Sort Method: quicksort  Memory: kB              ->  Hash Semi Join  (cost=2523.19..3223.63 rows= width=) (actual time=55.913..107.265 rows= loops=)
                    Hash Cond: ((t_zhld_ajdbxx.c_ajbh)::text = (t_zhld_zbajxx.c_ajbh)::text)                    ->  Index Scan using i_t_zhld_ajdbxx_m6 on t_zhld_ajdbxx  (cost=0.42..700.28 rows= width=) (actual time=0.065..22.005 rows= loops=)
                          Index Cond: (((c_zblx)::text = '1003'::text) AND ((c_dbfy)::text = '0'::text) AND ((c_gy)::text = '2550'::text))                    ->  Hash  (cost=2513.84..2513.84 rows= width=) (actual time=55.802..55.802 rows= loops=)
                          Buckets:  (originally )  Batches:  (originally )  Memory Usage: kB                          ->  HashAggregate  (cost=2499.56..2506.70 rows= width=) (actual time=30.530..43.275 rows= loops=)                                Group Key: t_zhld_zbajxx.c_ajbh                                ->  Index Scan using i_t_zhld_zbajxx_h3 on t_zhld_zbajxx  (cost=0.42..2497.77 rows= width=) (actual time=0.043..15.552 rows= loops=)
                                      Index Cond: ((n_dbzt = ) AND ((c_zblx)::text = '1003'::text) AND ((c_gy)::text = '2550'::text))        ->  Index Scan using t_zhld_db_pkey on t_zhld_db  (cost=0.28..8.30 rows= width=) (actual time=0.009..0.011 rows= loops=)
              Index Cond: (c_bh = t_zhld_ajdbxx.c_dbbh)              Filter: (((c_dbztbh)::text = '1003'::text) AND (n_state = ANY ('{1,2,3}'::integer[])))
Planning time: 1.154 ms
Execution time: 127.734 ms
This time we can see that ,ajdbxx and zbajxx The watch did hash semi join Eliminated nestedloop,cost Down to 3231.97. And use i_t_zhld_ajdbxx_m6Sub query in There are more than 10000 pieces of data in our result set , Try to use exists Equivalent rewriting in, See if there are better results
Equivalent rewriting SQL(2)
 Equivalent rewriting : take in Replace with exists:select c_ajbh, c_ah, c_cbfy, c_cbrxm, d_larq, d_jarq, n_dbjg, c_yqlyfrom (select c_bh from db_zxzhld.t_zhld_db  where n_state in (,,) and c_dbztbh='1003' )dbxx join (select c_ajbh, c_ah, c_cbfy, c_cbrxm, d_larq, d_jarq, n_dbjg, c_yqly,c_dbbh from db_zxzhld.t_zhld_ajdbxx   ajdbxxwhere c_zblx='1003'
 and c_dbfy='0' and c_gy = '2550' and exists (select distinct c_ajbh from db_zxzhld.t_zhld_zbajxx zbajxx where ajdbxx.c_ajbh = zbajxx.c_ajbh and n_dbzt =  and c_zblx = '1003' and c_gy = '2550' ) order by d_larq asc, c_ajbh asc)dbajon dbxx.c_bh = dbaj.c_dbbh
 limit  offset  Check the execution plan again :
Limit  (cost=1.12..2547.17 rows= width=) (actual time=0.140..0.727 rows= loops=)  ->  Nested Loop  (cost=1.12..2547.17 rows= width=) (actual time=0.136..0.689 rows= loops=)        ->  Nested Loop Semi Join  (cost=0.85..2538.84 rows= width=) (actual time=0.115..0.493 rows= loops=)              ->  Index Scan using i_t_zhld_ajdbxx_m6 on t_zhld_ajdbxx t2  (cost=0.42..700.28 rows= width=) (actual time=0.076..0.127 rows= loops=)
                    Index Cond: (((c_zblx)::text = '1003'::text) AND ((c_dbfy)::text = '0'::text) AND ((c_gy)::text = '2550'::text))              ->  Index Scan using i_t_zhld_zbajxx_c_ajbh on t_zhld_zbajxx t3  (cost=0.42..8.40 rows= width=) (actual time=0.019..0.019 rows= loops=)
                    Index Cond: ((c_ajbh)::text = (t2.c_ajbh)::text)                    Filter: (((c_zblx)::text = '1003'::text) AND ((c_gy)::text = '2550'::text) AND (n_dbzt = ))        ->  Index Scan using t_zhld_db_pkey on t_zhld_db  (cost=0.28..8.30 rows= width=) (actual time=0.007..0.008 rows= loops=)
              Index Cond: (c_bh = t2.c_dbbh)              Filter: (((c_dbztbh)::text = '1003'::text) AND (n_state = ANY ('{1,2,3}'::integer[])))
Planning time: 1.268 ms
Execution time: 0.859 ms

 It can be seen that the exist better , Final cost 2547.17(). Less t_zhld_zbajxx Tabular group by operation :Sort Key: t_zhld_ajdbxx.d_larq, t_zhld_ajdbxx.c_ajbh.( This step is due to the use of sort in the index )
(). Without grouping operations :Group Key: t_zhld_zbajxx.c_ajbh.

 The first () Why does this query eliminate t_zhld_zbajxx Tabular group by Operation? ?
 as a result of exists To replace the distinct The function of , Once the conditions are met, return immediately . So use exists The subquery can be removed directly distinct.
边栏推荐
- Short video platform development, click the input box to automatically pop up the soft keyboard
- ADC数字地DGND、模拟地AGND的谜团!
- 开户券商怎么选择?现在网上开户安全么?
- 如何设计一个秒杀系统?
- 创新技术领航者!华为云GaussDB获颁2022年云原生数据库领域权威奖项
- Asemi ultrafast recovery diode es1j parameters, es1j package, es1j specification
- A number of individual stocks in Hong Kong stocks performed actively, triggering investors' speculation and concern about the recovery of the Hong Kong stock market
- Codeforces Round #620 (Div. 2)ABC
- 根据年份获取第一天和最后一天
- 一文读懂麦克风典型应用电路
猜你喜欢

Intel arc A380 graphics card message summary: the entry-level price products of running point and bright driving need to be optimized

Ctfshow PHP features
QT布局管理器【QVBoxLayout,QHBoxLayout,QGridLayout】

Digital twin excavator of Tupu software realizes remote control
QT layout manager [qvboxlayout, qhboxlayout, qgridlayout]
NLP paper reading | improving semantic representation of intention recognition: isotropic regularization method in supervised pre training

How to use SQL window functions
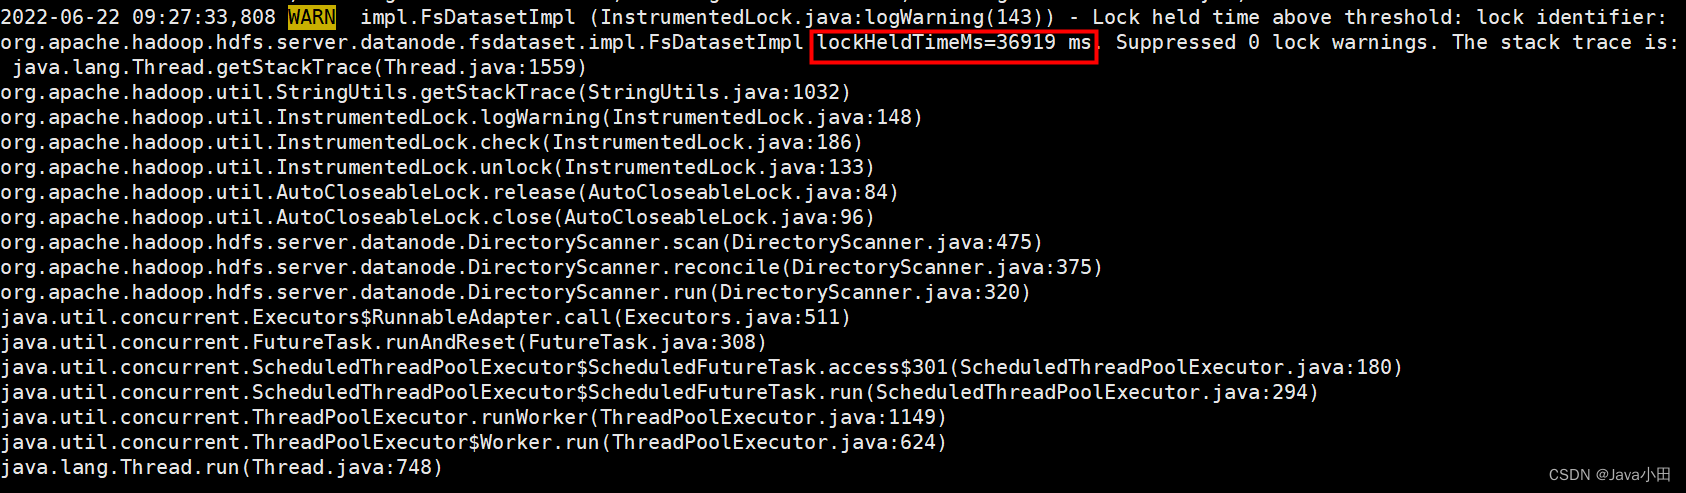
Troubleshooting of datanode entering stale status

Asemi ultrafast recovery diode es1j parameters, es1j package, es1j specification
![[network communication -- webrtc] source code analysis of webrtc -- bandwidth estimation at the receiving end](/img/b0/97dbf3d07a4ed86d6650a58a97a5fc.png)
[network communication -- webrtc] source code analysis of webrtc -- bandwidth estimation at the receiving end

随机推荐
Wechat applet: time selector for the estimated arrival date of the hotel
公司招了个五年经验的测试员,见识到了真正的测试天花板
How important is 5g dual card dual access?
Performance test bottleneck tuning in 10 minutes! If you want to enter a large factory, you must know
Comparison of asemi Schottky diode and ultrafast recovery diode in switching power supply
C. Add One--Divide by Zero 2021 and Codeforces Round #714 (Div. 2)
ABAP essay - material master data interface enhancement
What are the inductance parameters? How to choose inductance?
mysql-选择使用Repeatable read的原因
ABAP随笔-物料主数据界面增强
JMeter stress testing tutorial
Another breakthrough! Alibaba cloud enters the Gartner cloud AI developer service Challenger quadrant
What can the accelerated implementation of digital economy bring to SMEs?
How to configure MySQL log management
时间戳90K是什么意思?
解析 | 模-数(A/D)转换器
Importance of ERP management system
QT当中的【QSetting和.ini配置文件】以及【创建Resources.qrc】
How about stock online account opening and account opening process? Is online account opening safe?
What does websocket do?