当前位置:网站首页>Shengxin commonly used analysis graphics drawing 02 -- unlock the essence of volcano map!
Shengxin commonly used analysis graphics drawing 02 -- unlock the essence of volcano map!
2022-07-24 17:43:00 【Summer rain and autumn wind】

With R The basis of language , as well as ggplot2 Basis of drawing , our 「 Students often use analysis graphics 」 The drawing of can be put on the agenda ! This series , Elder martial brother began to take everyone to learn how to use R Language draw our own various analysis charts !
*Because all the analysis codes in this series are carefully sorted and commented by elder martial brother ! Welcome to thumb up 、 Collection 、 forward !
Your support is the biggest driving force for me to continuously update !
*
Sample data and code acquisition
The series includes :
Have you learned all kinds of heat maps ? General heat map Annular heat map
Unlock the essence of volcano map ! plot Function can draw volcano map ? High level function to draw volcano map --ggplot2、ggpurb
Classic enrichment analysis and Bubble Diagram 、 Histogram drawing Bubble plot Histogram drawing
Enrichment analysis circle diagram Enrichment analysis chord Draw a Sankey map that can impress reviewers Survival analysis -- KM diagram Basics PCA chart Clouds and rain Wayne Tu Ring interaction network diagram Interaction network diagram Cluster tree beautification Enrichment analysis bubble chart advanced version mantel test Correlation chart Clouds of words Waterfall Plot Forest map Manhattan Dumbbell chart Three wire table Nested circle graph Nomogram Bee colony diagram boxplot + Bessel curve Matrix scatter wait , Think of adding more !!!
The effect of volcano map in this issue is displayed

R Built-in function plot Can draw a volcanic map ?
##############
data <- read.csv("DEG.csv",row.names = 1)

color <- rep("#999999",nrow(data))

color[data$pvalue <0.05 & data$log2FoldChange > 1] <- "#FC4E07"
color[data$pvalue <0.05 & data$log2FoldChange < -1] <- "#00AFBB"

par(oma = c(0,2,0,0))

plot(data$log2FoldChange,-log10(data$pvalue),pch = 16,cex = 0.5,
     xlim = c(-4,4), ylim = c(0,32), col = color, frame.plot = F,
     xlab = "log2FC", ylab = "-log10(Pvalue)", cex.axis = 1, cex.lab = 1.3)

#  Add Guides :
abline(h = -log10(0.05),lwd = 2, lty = 3)  # lwd Set the width of the line ,lty Set the type of line ;
abline(v = c(-1,1),lwd = 2, lty = 3)  # lwd Set the width of the line ,lty Set the type of line ;

#  Add legend
legend(x = 3, y = 32, legend = c("Up","Normal","Down"),
       bty = "n", #  Remove the border
       pch = 19,cex = 1, #  Set the style and size of the point
       x.intersp = 0.3, #  Set the distance between words and points ;
       y.intersp = 0.3, #  Set the height difference between points , Equivalent to line spacing ;
       col = c("#FC4E07","#999999","#00AFBB"))

#  Add tags :
color = c()
color[which(data[1:10,]$regulate == "Up")] = "#FC4E07"
color[which(data[1:10,]$regulate != "Up")] = "#00AFBB"
text(data$log2FoldChange[1:10],-log10(data$pvalue)[1:10],
     labels = data$row[1:10],
     adj = c(0,1.5),
     cex = 0.6,
     col = color)
Encapsulate the above code into a function , Later call , You can map with one click :
#  Wrapper functions :
#  adjustment 1: xlim and ylim We have to get rid of
#  adjustment 2:  Change the position of the legend
plotVoc <- function(data){
  color <- rep("#999999",nrow(data))

  color[data$pvalue <0.05 & data$log2FoldChange > 1] <- "#FC4E07"
  color[data$pvalue <0.05 & data$log2FoldChange < -1] <- "#00AFBB"

  par(oma = c(0,2,0,0))

  plot(data$log2FoldChange,-log10(data$pvalue),pch = 16,cex = 0.5,
       col = color, frame.plot = F,
       xlab = "log2FC", ylab = "-log10(Pvalue)", cex.axis = 1, cex.lab = 1.3)

  #  Add Guides :
  abline(h = -log10(0.05),lwd = 2, lty = 3)  # lwd Set the width of the line ,lty Set the type of line ;
  abline(v = c(-1,1),lwd = 2, lty = 3)  # lwd Set the width of the line ,lty Set the type of line ;

  #  Add legend
  legend(x = 3, y = max(-log10(data$pvalue)), legend = c("Up","Normal","Down"),
         bty = "n", #  Remove the border
         pch = 19,cex = 1, #  Set the style and size of the point
         x.intersp = 0.3, #  Set the distance between words and points ;
         y.intersp = 0.3, #  Set the height difference between points , Equivalent to line spacing ;
         col = c("#999999", "#FC4E07","#00AFBB"))

  #  Add tags :
  color = c()
  color[which(data[1:10,]$regulate == "Up")] = "#FC4E07"
  color[which(data[1:10,]$regulate != "Up")] = "#00AFBB"
  text(data$log2FoldChange[1:10],-log10(data$pvalue)[1:10],
       labels = data$row[1:10],
       adj = c(0,1.5),
       cex = 0.6,
       col = color)
}


data <- read.csv("DEG2.csv",row.names = 1)

plotVoc(data)
High level function to draw volcano map --ggplot2、ggpurb
Use ggplot2 draw :
library(ggplot2)

data <- read.csv("DEG.csv",row.names = 1)

#################
# ggplot2 Mapping volcanoes
data$label <- c(rownames(data)[1:10],rep(NA,nrow(data) - 10))

ggplot(data,aes(log2FoldChange,-log10(pvalue),color = regulate)) +
  xlab("log2FC") +
  geom_point(size = 0.6) +
  scale_color_manual(values=c("#00AFBB","#999999","#FC4E07")) +
  geom_vline(xintercept = c(-1,1), linetype ="dashed") +
  geom_hline(yintercept = -log10(0.05), linetype ="dashed") +
  theme(title = element_text(size = 15), text = element_text(size = 15)) +
  theme_classic() +
  geom_text(aes(label = label),size = 3, vjust = 1,hjust = -0.1)
Use ggpurb Of scatter Functions can also be drawn :
#############
#  Use ggpurb Mapping volcanoes :
library(ggpubr)
data$pvalue <- -log10(data$pvalue)
ggscatter(data,
          x = "log2FoldChange",
          y = "pvalue",
          ylab="-log10(P.value)",
          size=0.6,
          color = "regulate",
          label = rownames(data),
          label.select = rownames(data)[1:10],
          repel = T,
          palette = c("#00AFBB", "#999999", "#FC4E07")) +
          geom_hline(yintercept = 1.30,linetype ="dashed") +
          geom_vline(xintercept = c(-1,1),linetype ="dashed")

Catalogue of previous excellent graphics
copying
The articles
边栏推荐
- HCNP Routing&Switching之DHCP中继
- [waiting for insurance] what does waiting for insurance rectification mean? What are the rectification contents?
- Link editing tips of solo blog posts illegal links
- 213. 打家劫舍 II-动态规划
- NC port forwarding
- 2022 ranking list of database audit products - must see!
- Detailed explanation of ansible automatic operation and maintenance (V) the setting and use of variables in ansible, the use of jinja2 template and the encryption control of ansible
- An example of using viewthatfits adaptive view in swiftui 4.0
- C language to achieve a static version of the address book
- Is it safe for qiniu to open an account?
猜你喜欢

Today, I met a 38K from Tencent, which let me see the ceiling of the foundation
Open source Invoicing system, 10 minutes to complete, it is recommended to collect!
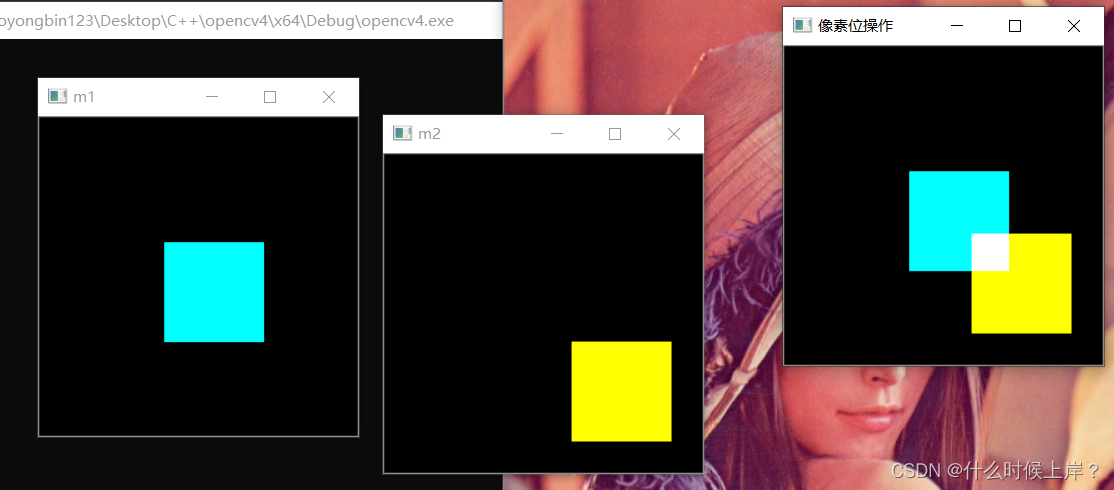
图像像素的逻辑操作

socat 端口转发

Safety: how to provide more protection for pedestrians

portmap 端口转发

调整图像亮度的滚动条演示实验

HCNP Routing&Switching之DHCP中继

Array learning navigation

C language programming training topics: K characters in left-handed string, little Lele and Euclidean, printing arrow pattern, civil servant interview, poplar matrix
随机推荐
Safety: how to provide more protection for pedestrians
C语言编程训练题目:左旋字符串中的k个字符、小乐乐与欧几里得、打印箭型图案、公务员面试、杨树矩阵
In the morning, Tencent took out 38K, which let me see the ceiling of the foundation
ansible自动化运维详解(五)ansible中变量的设定使用、JINJA2模板的使用以及ansible的加密控制
socat 端口转发
wallys/IPQ8074A 4x4 2.4G 8x8 5G 802.11ax
Detailed explanation of ansible automatic operation and maintenance (V) the setting and use of variables in ansible, the use of jinja2 template and the encryption control of ansible
C language custom type explanation - structure
[how to optimize her] teach you how to locate unreasonable SQL? And optimize her~~~
Development Series III of GaN (lapgan, srgan)
Scept: consistent and strategy based trajectory prediction for planned scenarios
700. Search DFS method in binary search tree
干货|值得收藏的三款子域名收集工具
二维卷积——torch.nn.conv2d的使用
portmap 端口转发
Portmap port forwarding
深入解析著名的阿里云Log4j 漏洞
SV casts and constants
An example of using viewthatfits adaptive view in swiftui 4.0
Natbypass port forwarding