当前位置:网站首页>Introduction and download of nine npp\gpp datasets
Introduction and download of nine npp\gpp datasets
2022-06-24 18:41:00 【Geographical space of ruiduobao】
Data brief
China wants to be in 2030 Achieve carbon peak in ,2060 Carbon neutralization was achieved in . How to measure ecosystem carbon sources and sinks , And detect the dynamic distribution of space-time ? Scientists have chosen a key part of the terrestrial carbon cycle NPP, Regard it as an indicator of the energy flow and ecosystem function of the ecosystem .
Total primary productivity GPP(Gross Primary Production) It means that the ecosystem producers obtain chemical energy within a certain period of time , The rate at which it is stored in biomass .
Part of the energy fixed by the plant is used for its own growth R, The production of the remaining part is the net primary productivity NPP(Net Primary Production
) .

At present, the Chinese Internet is about NPP The summary blog of the data set has almost no , Here I briefly summarize nine common NPP And GPP Data sets .

Global data set
It mainly introduces several kinds of NPP/GPP Data sets .
MODIS GPP\NPP (500m)
MODIS GPP\NPP Data is the most widely used data set at present , The data set has been verified by comparing the product with the ground reference point , And provide 14 Data categories available for users to download .
| name | type | The resolution of the | The way of synthesis | source |
|---|---|---|---|---|
| MOD17A2H v006 | GPP | 500m | 8 God | Terra |
| MOD17A2H v061 | GPP | 500m | 8 God | Terra |
| MOD17A2HGF v006 | GPP | 500m | 8 God | Terra |
| MOD17A2HGF v061 | GPP | 500m | 8 God | Terra |
| MOD17A3H v006 | NPP | 500m | 1 year | Terra |
| MOD17A3HGF v006 | NPP | 500m | 1 year | Terra |
| MOD17A3HGF v061 | NPP | 500m | 1 year | Terra |
| MYD17A2H v061 | GPP | 500m | 8 God | Aqua |
| MYD17A2H v006 | GPP | 500m | 8 God | Aqua |
| MYD17A2HGF v006 | GPP | 500m | 8 God | Aqua |
| MYD17A2HGF v061 | GPP | 500m | 8 God | Aqua |
| MYD17A3H v006 | NPP | 500m | 1 year | Aqua |
| MYD17A3HGF v061 | NPP | 500m | 1 year | Aqua |
| MYD17A3HGF v006 | NPP | 500m | 1 year | Aqua |
among ,Terra The satellite observation data is MOD data ,aqua The satellite observation data is MYD data ,Terra It is in the local morning 10:30 Transit ,auqa In the local afternoon 1:30 Transit .A2 yes GPP data , Every time 8 Days for data synthesis .A3 yes NPP data , Synthesize every year .
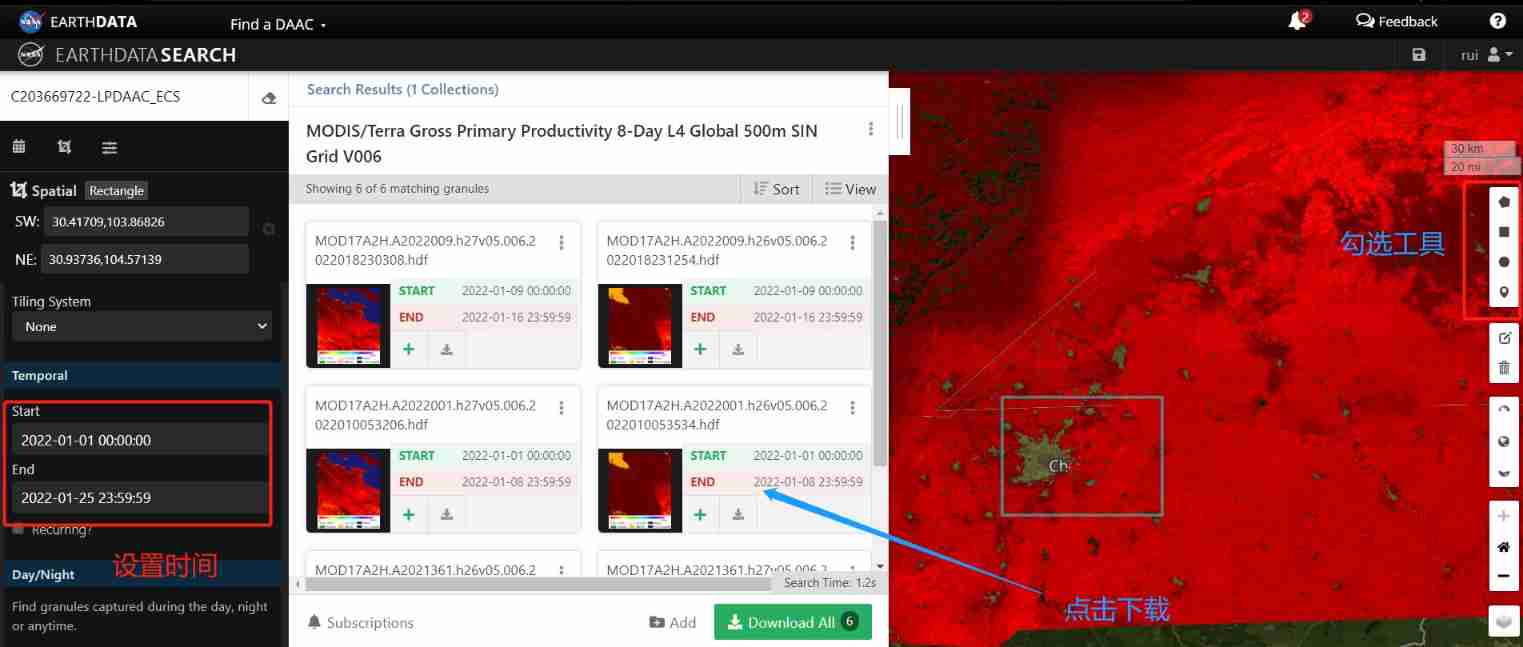
If you need to download this series of data , First of all to enter USGS Resource search bar for (https://lpdaac.usgs.gov/product_search/), Search for Primary Productivity:

Select the data set to be downloaded , Click to enter , The page will display the relevant information and download methods of the dataset . Click on Access Data, Get download link :

There are several ways to download , You can choose NASA Earthdata Search, Because you can jump directly to the data selection page :
If you don't log in NASA, Log in first , Then click on the data to download .

Go to the website 、 Set filter time (2022 year 1 At the beginning of )、 Location ( Chengdu and Ziyang )、 Select an image to download :
After downloading, use the software to open the video , Have a look :

1982–2018 year GPP(0.05°)
This data set is published in ESSD On , The first author is from Sun Yat sen University **Zheng Yi **. The author passes EC-LUE The model generates 0.05° Spatial resolution and 8 Day time resolution 1982–2018 In the world GPP Data sets .

If you need to download the dataset , Open the official link of the paper (https://essd.copernicus.org/articles/12/2725/2020/), choice Assets Data links in

When I open the link , Select the data of the corresponding year to download :

After the data is downloaded , Unzip to see the year every 8 Days of datasets , The last few numbers represent the number of days , such as 2018121 representative 2018 In the first 121 God :

Load into gis In software , View data effects :

Related literature :Zheng Y , Shen R , Wang Y , et al. Improved estimate of global gross primary production for reproducing its long-term variation, 1982–2017[J]. Earth System Science Data Discussions, 2019:1-31.
1988-2020 year GPP (0.25°)
This data set is the first global data set derived from microwave remote sensing GPP Data sets , Cover 1988-2020 year , The spatial resolution is 0.25°. The data were produced using a new combined frequency vegetation optical depth climatic profile with ERA5-Land Temperature data , In the new tandem drive GPP Estimate the method to make a global GPP data .

If you need to download the data , First, include the address of the thesis :https://essd.copernicus.org/preprints/essd-2021-209/

Enter the data download interface , Click to download . The data is a nc Data collection , All years are included .

Related literature :Benjamin W, Irene T,2, Leander M , et al. VODCA2GPP – A new global, long-term (1988–2020) GPP dataset from microwave remote sensing[J]. Earth System Science Data, 2021
2000-2016 year GPP (0.05°)
This data set contains information from the vegetation photosynthesis model (VPM) Of GPP, It has two spatial resolutions (0.05 and 0.5 degree ) And three time resolutions (8 God 、 monthly 、 Every year, )

If you need to download the data , Go to the database website of the United States Department of agriculture , Or click this link (https://data.nal.usda.gov/dataset/global-moderate-resolution-dataset-gross-primary-production-vegetation-2000%E2%80%932016)

Download resource file , After extracting this file, there will be two .tab file :

Use Notepad to open... With links .tab Format file , Copy the link to the relevant year , such as 2016 Year is :https://hs.pangaea.de/Maps/GPPVPM/gpp_2016.zip, Readers can translate 2016 It is amended as follows 2000-2016 Any year can also be downloaded .

The data is very big , I won't demonstrate data download :

Related literature : Zhang Y , Xiao X , Wu X , et al. A global moderate resolution dataset of gross primary production of vegetation for 2000–2016[J]. Scientific Data, 2017, 4:170165.
1951-2000 year NPP (0.5°)
Dataset name :World maps of climatological net primary production of biomass, NPP
This data set is based on the latest temperature and precipitation grid data set , Generated 1951 - 2000 During the year NPP.

Data download needs to enter FAO Resource search pages for , Click on the search World maps of climatological net primary production of biomass:

After entering the page , Select the corresponding time period to download . It should be noted that this dataset has only a time period , There is no specific year :

Open the video after downloading the data :

* Related literature :*J Grieser, R Gommes, S Cofield, & M Bernardi. World maps of climatological net primary production of biomass, NPP.
Regional datasets
This paper mainly introduces some practical and interesting regional data sets . For example, in the United States 30m The resolution of the NPP And the American day by day GPP.
The United States 2000-2019 Every day in GPP(250m)
The dataset is Chongya Jiang On 2021 Years published in ESSD On , This data set covers... In the United States 250m Day by day resolution GPP data .

If you need to download the dataset , Open the thesis website :https://essd.copernicus.org/articles/13/281/2021/

Click on DOI, Go to download address :https://daac.ornl.gov/cgi-bin/dsviewer.pl?ds_id=1786, land NASA account number :

Then pull the page to the bottom , Select the appropriate data download . This data totals 11.6TB, Select the data you are interested in :

Related literature :Jiang C , Guan K , Wu G , et al. A daily, 250 m and real-time gross primary productivity product (2000–present) covering the contiguous United States[J]. Earth System Science Data, 2021, 13(2):281-298.
The United States 1990 year -2019 Every year 16 God NPP/GPP(30 rice )
This data covers the United States , The production method is :
a) from Landsat get 1986 Year to 2016 Year of 30 m The resolution of the 16 Days of GPP And the year NPP;
b) from MODIS get 2001 - 2016 year 250 m Resolution 8 God GPP And the year NPP.
c) Based on coming from FLUXNET2015 The eddy covariance flux of the database is derived GPP data .

If you need to download the data , Go to the website :http://files.ntsg.umt.edu/data/Landsat_Productivity/, The website is displayed in the form of folders , You can download it directly :

* Related literature :*Robinson, N.P., B.W. Allred, W.K. Smith, M.O. Jones, A. Moreno, T.A. Erickson, D.E. Naugle, and S.W. Running. 2018. Terrestrial primary production for the conterminous United States derived from Landsat 30 m and MODIS 250 m. Remote Sensing in Ecology and Conservation
China 2000-2010 year NPP (1km)
The Chinese Academy of Sciences NPP The data coverage time is 2000 year -2010 year , A resolution of 1km:
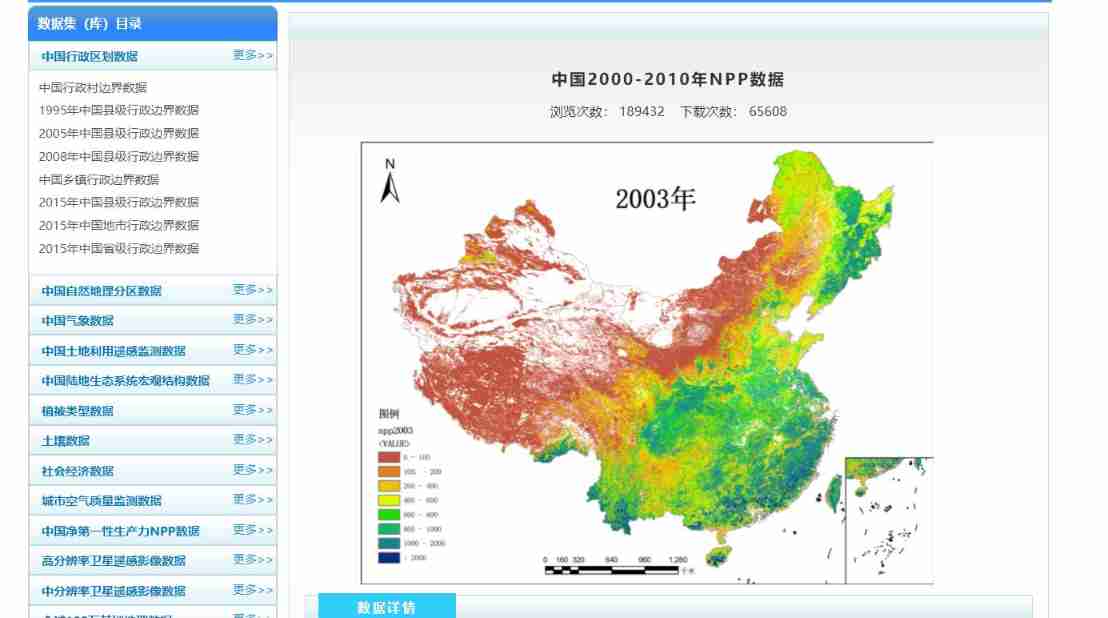
Download by entering :https://www.resdc.cn/data.aspx?DATAID=204, Click download :

China 1985-2015 year NPP(1KM)
Chenpengfei, a teacher of the Chinese Academy of Sciences, made a monthly net primary productivity 1 Kilometer grid dataset (1985-2015),

The download method is to access the global change scientific research data website :http://www.geodoi.ac.cn/ , Search for monthly net primary productivity :

Click to enter , Then select the corresponding year to download data :

Click to download

Download data of interest , Select the corresponding month for display :

Related literature :
Chen Pengfei . North latitude 18° Monthly net primary productivity of terrestrial ecosystems in northern China 1 Kilometer grid dataset (1985-2015)[J]. Journal of global change data ( Chinese and English ), 2019(1):16.
Other reference :
MajorDifferences. Difference between Gross Primary Productivity and Net Primary Productivity
Wangzhaosheng . 1949-2008 The terrestrial ecosystem of East Asia in NPP and GPP The evolution of space-time pattern [D]. Hunan University of science and technology , 2012.
Geoscience remote sensing data collection (www.gisrsdata.com) The website has been launched for the first time 70 days , distance 100 The appointed time is coming .

But the data download tutorial is not comprehensive enough , If there is 
边栏推荐
猜你喜欢
Business based precipitation component = & gt; manage-table

Wechat applet to realize stacked rotation

Leetcode weekly buckle 281

Sentry series satellite introduction and download tutorial

【Leetcode】旋转系列(数组、矩阵、链表、函数、字符串)

微服务系统设计——接口文档管理设计

微服務系統設計——子服務項目構建

SAP license:sap s/4hana is the answer

Air pollution gas satellite data download tutorial

解读HarmonyOS 应用与服务生态

随机推荐
解读HarmonyOS 应用与服务生态
UnityShader 世界坐标不随模型变化
[JS Framework] Failed to execute the callback function:
Use ado Net call stored procedure
Interview algorithm - string question summary
JS local storage
SAP license:sap s/4hana is the answer
JDBC writes Chinese garbled code to the database
R中的指数回归
ASP. Net hosting uploading file message 500 error in IIS
Leetcode daily question solution: 717 1-bit and 2-bit characters - reverse order
congratulate! The first dragon lizard community annual outstanding contribution award is announced. Check it now
Microservice system design -- interface document management design
为什么 useEvent 不够好
JS pre parsing
Using to release resources
【Leetcode】旋转系列(数组、矩阵、链表、函数、字符串)
Two micro service interviews where small companies suffer losses
Spatial simulation model acquisition future land cover tutorial
What if the database table structure changes? Smartbi products support one click synchronization