当前位置:网站首页>hands-on-data-analysis 第二单元 第四节数据可视化
hands-on-data-analysis 第二单元 第四节数据可视化
2022-06-23 16:31:00 【沧夜2021】
hands-on-data-analysis 第二单元 第四节数据可视化
文章目录
1.简单绘图
1.1.导入库
#inline表示将图表嵌入到Notebook中
%matplotlib inline
import numpy as np
import pandas as pd
import matplotlib.pyplot as plt
1.2.基本的绘图示例
import numpy as np
data  = np.arange(10)
data
plt.plot(data)

1.3.子图示例
fig = plt.figure()
ax1 = fig.add_subplot(2,2,1)
ax2 = fig.add_subplot(2,2,2)
ax3 = fig.add_subplot(2,2,3)
ax4 = fig.add_subplot(2,2,4)

1.4.子图绘图示例
fig = plt.figure()
ax1 = fig.add_subplot(2,2,1)
ax2 = fig.add_subplot(2,2,2)
ax3 = fig.add_subplot(2,2,3)
#k--是绘制黑色分段线的选项
plt.plot(np.random.randn(50).cumsum(),'k--')
_ = ax1.hist(np.random.randn(100),bins=20,color='k',alpha=0.3)
ax2.scatter(np.arange(30),np.arange(30)+3*np.random.randn(30))

1.5. pyplot.subplots选项
| 参数 | 描述 |
|---|---|
| nrows | 子图的行数 |
| ncols | 子图的列数 |
| sharex | 所有子图使用相同的x轴刻度(调整xlim会影响所有子图) |
| sharey | 所有子图使用相同的y轴刻度(调整ylim会影响所有子图) |
| subplot_kw | 传入add_subplot的关键字参数字典,用于生成子图 |
| **fig_kw | 在生成图片时使用的额外关键字参数,例如plt.subplot(2,2,figsize(8,6)) |
2.可视化展示泰坦尼克号数据集中男女中生存人数分布情况
sex = text.groupby('Sex')['Survived'].sum()
sex.plot.bar()
plt.title('survived_count')
plt.show()

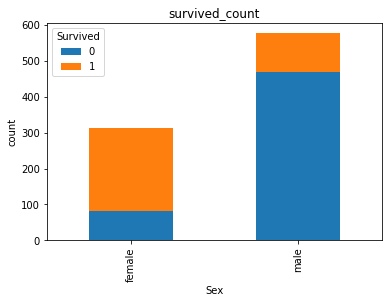
3.可视化展示泰坦尼克号数据集中男女中生存人与死亡人数的比例图
text.groupby(['Sex','Survived'])['Survived'].count().unstack().plot(kind='bar',stacked='True')
plt.title('survived_count')
plt.ylabel('count')
4.可视化展示泰坦尼克号数据集中不同票价的人生存和死亡人数分布情况。
# 计算不同票价中生存与死亡人数 1表示生存,0表示死亡
fare_sur = text.groupby(['Fare'])['Survived'].value_counts().sort_values(ascending=False)
fare_sur
fig = plt.figure(figsize=(20, 18))
fare_sur.plot(grid=True)
plt.legend()
plt.show()

5.可视化展示泰坦尼克号数据集中不同仓位等级的人生存和死亡人员的分布情况
# 1表示生存,0表示死亡
pclass_sur = text.groupby(['Pclass'])['Survived'].value_counts()
pclass_sur
import seaborn as sns
sns.countplot(x="Pclass", hue="Survived", data=text)
6.可视化展示泰坦尼克号数据集中不同年龄的人生存与死亡人数分布情况
facet = sns.FacetGrid(text, hue="Survived",aspect=3)
facet.map(sns.kdeplot,'Age',shade= True)
facet.set(xlim=(0, text['Age'].max()))
facet.add_legend()

7.可视化展示泰坦尼克号数据集中不同仓位等级的人年龄分布情况。
text.Age[text.Pclass == 1].plot(kind='kde')
text.Age[text.Pclass == 2].plot(kind='kde')
text.Age[text.Pclass == 3].plot(kind='kde')
plt.xlabel("age")
plt.legend((1,2,3),loc="best")

边栏推荐
- VGg download (.Net file and imagenet-vgg-verydeep-19)
- 官方零基础入门 Jetpack Compose 的中文课程来啦!
- 数学分析_证明_第1章:可数个可数集之并为可数集
- TQ of R language using tidyquant package_ The transmute function calculates the daily, monthly and weekly returns of a stock. Ggplot2 uses the bar plot to visualize the monthly return data of the stoc
- 谈谈redis缓存击穿透和缓存击穿的区别,以及它们所引起的雪崩效应
- IFLYTEK neuroimaging disease prediction program!
- stylegan1: a style-based henerator architecture for gemerative adversarial networks
- 以 27K 成功入职字节跳动,这份《 软件测试面试笔记》让我受益终身
- DataNode进入Stale状态问题排查
- I successfully joined the company with 27K ByteDance. This interview notes on software testing has benefited me for life
猜你喜欢

Interface ownership dispute

Network remote access raspberry pie (VNC viewer)

Code implementation of golang binary search method
【网络通信 -- WebRTC】WebRTC 源码分析 -- PacingController 相关知识点补充

官方零基础入门 Jetpack Compose 的中文课程来啦
C#与数据库连接

Apache foundation officially announced Apache inlong as a top-level project

stylegan3:alias-free generative adversarial networks

Stick to five things to get you out of your confusion

QT当中的【QSetting和.ini配置文件】以及【创建Resources.qrc】
随机推荐
Mobile cloud jointly builds the capability base of information innovation cloud and helps the development of China's information innovation industry
Date转换为LocalDateTime
Shushulang passed the listing hearing: the gross profit margin of the tablet business fell, and the profit in 2021 fell by 11% year-on-year
EasyPlayer移动端播放webrtc协议时长按播放页面无法关闭“关于我们”页面
Another breakthrough! Alibaba cloud enters the Gartner cloud AI developer service Challenger quadrant
The evolution of social structure and capital system brought about by the yuan universe
元宇宙带来的社会结构和资本制度演变
华为手机通过adb安装APK提示“签名不一致,该应用可能已被修改”
内网渗透令牌窃取
图扑软件以轻量化建模构建智慧城市
R language uses colorblinr package to simulate color blind vision, and uses edit to visualize the image of ggplot2_ The colors function is used to edit and convert color blindness into visual results
公司招了个五年经验的测试员,见识到了真正的测试天花板
How to make sales management more efficient?
C. Product 1 Modulo N-Codeforces Round #716 (Div. 2)
Openresty Foundation
Six stone programming: the subtlety of application
Leetcode: interview question 08.13 Stacking bin [top-down DFS + memory or bottom-up sorting + DP]
Mathematical analysis_ Certification_ Chapter 1: the union of countable sets is countable
The R language uses the RMSE function of the yardstick package to evaluate the performance of the regression model, the RMSE of the regression model on each fold of each cross validation (or resamplin
右腿驱动电路原理?心电采集必备,有仿真文件!