当前位置:网站首页>Face recognition determination threshold
Face recognition determination threshold
2022-06-23 05:28:00 【AI vision netqi】
Catalog
How to set the threshold in face recognition ?
face TAR FAR Calculation :
How to set the threshold in face recognition ?
In face recognition threshold How to set ?
With the wide application of face recognition technology , Most users may not understand one aspect of face recognition , There are also a variety of questions , below , It mainly explains how to set the threshold in visual face recognition ?
First, let's take a look at the set of data provided ( The absolute value has been modified , Qualitatively speaking ).
False recognition rate | Passing rate | threshold |
0.01 | 0.999 | 64 |
0.001 | 0.998 | 68 |
0.0001 | 0.996 | 72 |
1e-5 | 0.993 | 76 |
1e-6 | 0.985 | 80 |
1e-7 | 0.950 | 84 |
1e-8 | 0.300 | 88 |
Through this set of data , The following conclusions can be drawn :
First, error recognition rate 、 There is a correlation between the passing rate and the threshold , but It belongs to nonlinear relation
Maybe most people see this set of data , The higher the threshold is , The lower the passing rate and error recognition rate , The lower the threshold , The higher the pass rate and error recognition rate .
This leads to a common misunderstanding , The customer thinks that the higher the pass rate , The better the experience , Then the threshold should be set lower . But the higher the passing rate , The higher the error rate , It means that the ability to prevent risks will decline , Therefore, the setting of threshold value should comprehensively consider the customer experience and risk prevention ability . The more accurate statement should be under the specified threshold , company A The pass rate of is higher than that of other companies , The error rate is also lower than that of other companies ,, This means that the company A Our face recognition algorithm is better than other companies .
In addition, the threshold cannot be set too high , From the data, we can see that , After the threshold is continuously raised , The pass rate and the error rate also drop rapidly . At present, face recognition can only be used as an auxiliary authentication means , It cannot be equated with the second generation Key Such a strong authentication tool , If the amount of face data is large enough , There must be misunderstanding , There is no way to risk 0.
The data provided is based on their own face recognition test base , threshold 、 The error rate and pass rate are not absolute . But from a qualitative point of view , Still worthy of reference . If there are a large number of multiple births in the test base , Or the data scale of face database is very large , Then the results will be different .
python draw roc curve :
# -*- coding: utf-8 -*-
"""
Created on Thu Sep 21 16:13:04 2017
@author: lizhen
"""
import numpy as np
import matplotlib.pyplot as plt
from sklearn import svm, datasets
from sklearn.metrics import roc_curve, auc ### Calculation roc and auc
from sklearn import model_selection as cross_validation
# Import some data to play with
iris = datasets.load_iris()
X = iris.data
y = iris.target
## Turn into 2 classification
X, y = X[y != 2], y[y != 2]
# Add noisy features to make the problem harder
random_state = np.random.RandomState(0)
n_samples, n_features = X.shape
X = np.c_[X, random_state.randn(n_samples, 200 * n_features)]
# shuffle and split training and test sets
X_train, X_test, y_train, y_test = cross_validation.train_test_split(X, y, test_size=.3, random_state=0)
# Learn to predict each class against the other
svm = svm.SVC(kernel='linear', probability=True, random_state=random_state)
### adopt decision_function() Calculated y_score Value , Use in roc_curve() Function
y_score = svm.fit(X_train, y_train).decision_function(X_test)
# Compute ROC curve and ROC area for each class
fpr, tpr, threshold = roc_curve(y_test, y_score) ### Calculate the true rate and false positive rate
roc_auc = auc(fpr, tpr) ### Calculation auc Value
plt.figure()
lw = 2
plt.figure(figsize=(10, 10))
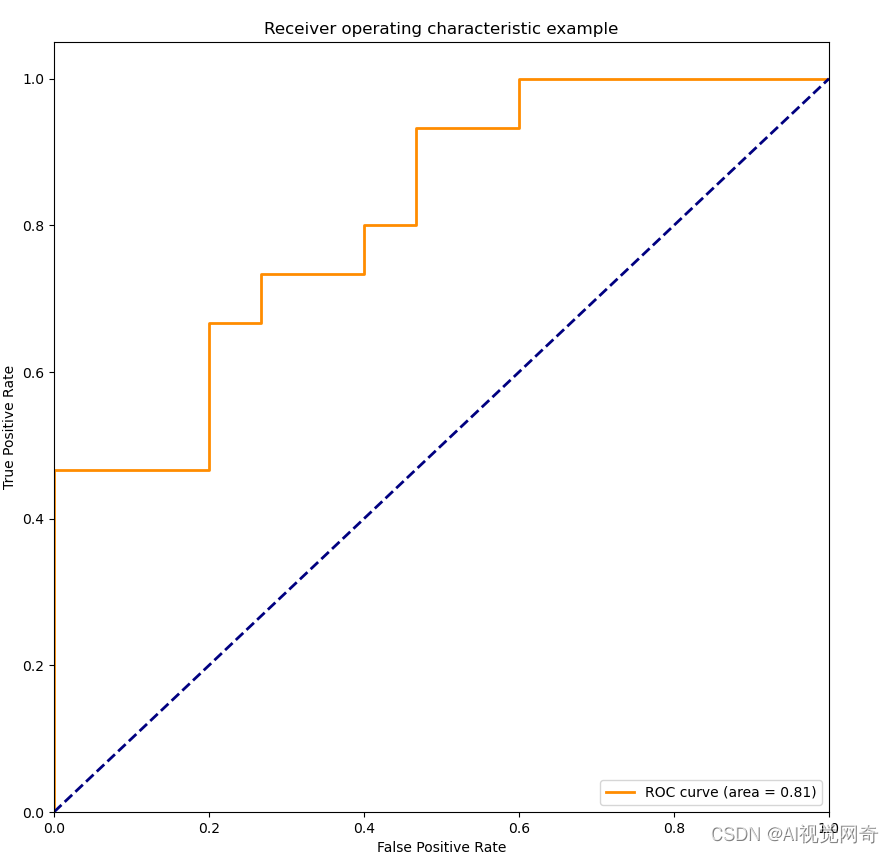
plt.plot(fpr, tpr, color='darkorange', lw=lw, label='ROC curve (area = %0.2f)' % roc_auc) ### The false positive rate is the abscissa , The true rate makes the curve for the ordinate
plt.plot([0, 1], [0, 1], color='navy', lw=lw, linestyle='--')
plt.xlim([0.0, 1.0])
plt.ylim([0.0, 1.05])
plt.xlabel('False Positive Rate')
plt.ylabel('True Positive Rate')
plt.title('Receiver operating characteristic example')
plt.legend(loc="lower right")
plt.show()
roc curve :
from : use Python draw ROC curve _- Never compromise - The blog of -CSDN Blog _python do roc curve
from sklearn.metrics import roc_curve, auc # Data preparation
import numpy as np
from sklearn import metrics
import matplotlib.pyplot as plt
y = np.array([1, 1,1, 2, 2,2])
scores = np.array([0.1, 0.4,0.5, 0.35, 0.8,0.9])
# roc_curve The input is
# y: Sample labels
# scores: The probability output of the model to the sample is positive
# pos_label: Labels marked as positive examples , In this case, it is marked as 2 Is a positive example
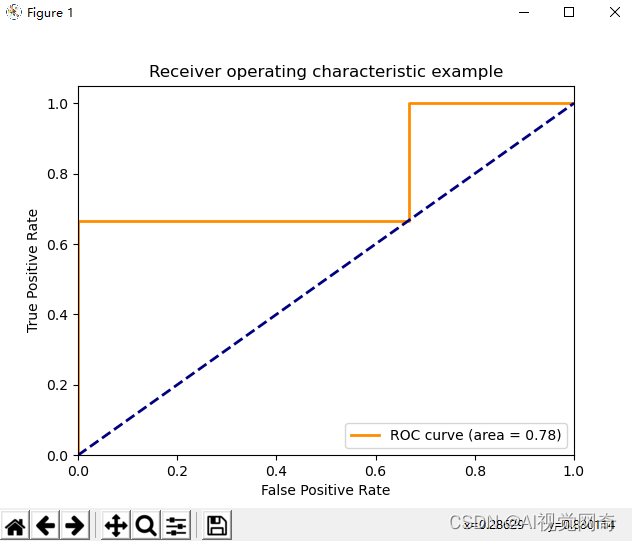
fpr, tpr, thresholds = metrics.roc_curve(y, scores, pos_label=2) # False positive rate
print(fpr)
# array([0., 0.5, 0.5, 1.]) # True positive rate
print(tpr)
# array([0.5, 0.5, 1., 1.]) # threshold
print(thresholds)
# array([0.8, 0.4, 0.35, 0.1])
auc = metrics.auc(fpr, tpr)
print(auc)
plt.figure()
lw = 2
plt.plot(fpr, tpr, color='darkorange', lw=lw, label='ROC curve (area = %0.2f)' % auc)
plt.plot([0, 1], [0, 1], color='navy', lw=lw, linestyle='--')
plt.xlim([0.0, 1.0])
plt.ylim([0.0, 1.05])
plt.xlabel('False Positive Rate')
plt.ylabel('True Positive Rate')
plt.title('Receiver operating characteristic example')
plt.legend(loc="lower right")
plt.show()
边栏推荐
- VMware network connection error unit network service not found
- Raspberry pie network remote access
- Jetpack compose menubar Desktop Menu from door opening to entry
- MCS:离散随机变量——Bernoulli分布
- Chapter IX app project test (1)
- 渗透测试基础 | 附带测试点、测试场景
- 云原生架构(04)-CNCF
- Penetration test basis | attached test points and test scenarios
- A bug in rtklib2.4.3 B34 single point positioning
- H5 adaptive full screen
猜你喜欢

STP summary

(IntelliJ) plug in background image plus

Array The from method creates an undefined array of length n

JVM原理之完整的一次GC流程

牛B程序员在“创建索引”时都会注意啥?

Missing essential plugin
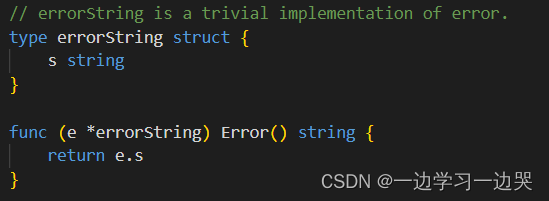
Go language - custom error
![[leetcode] longest increasing subsequence problem and its application](/img/e0/d666dccec1f65eed61fce83ac2190a.png)
[leetcode] longest increasing subsequence problem and its application
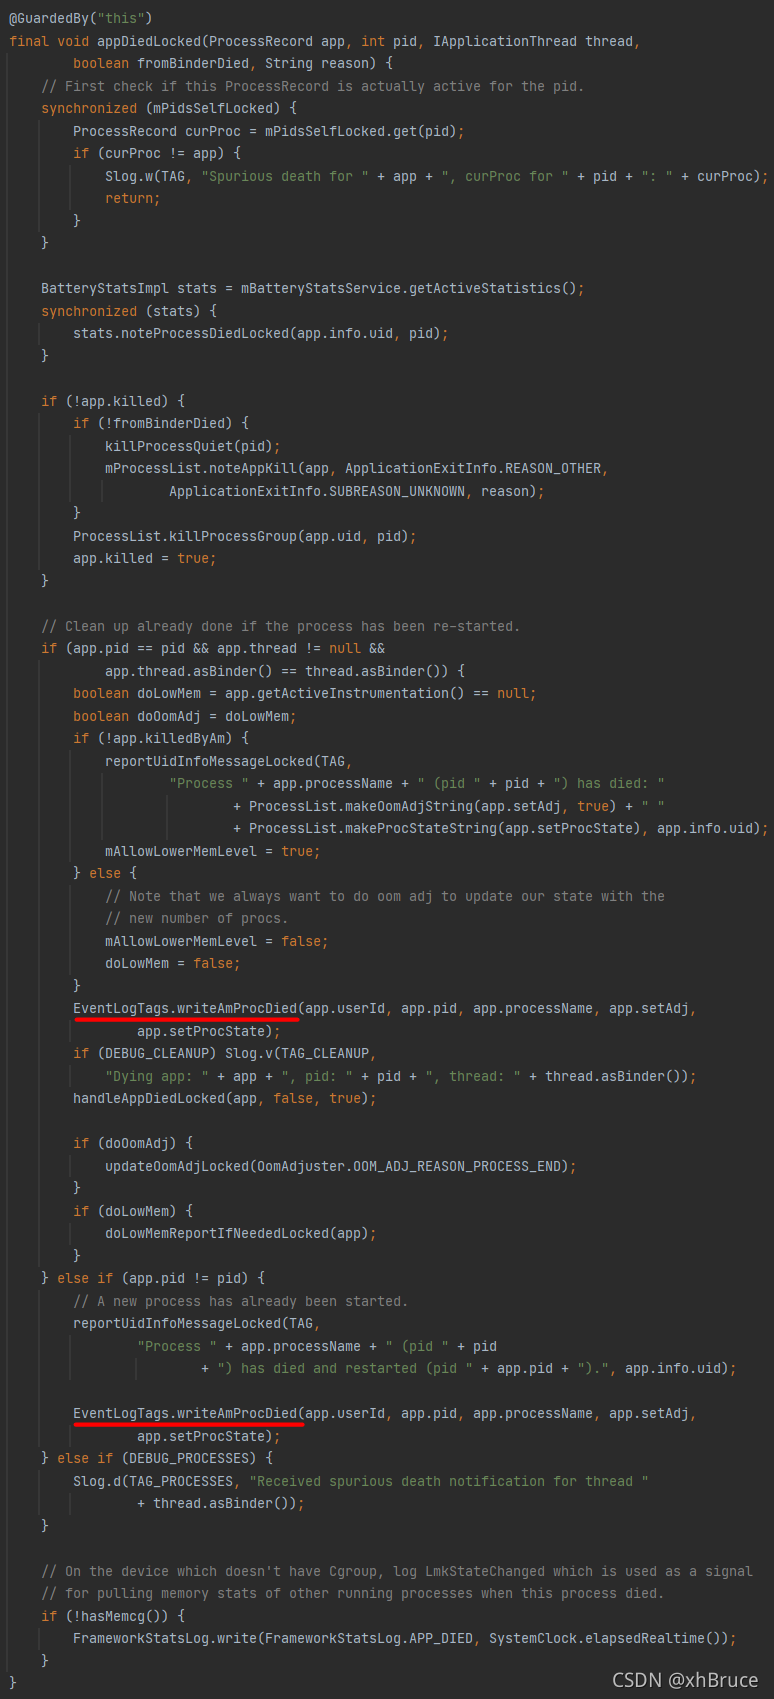
应用挂了~
What do Niu B programmers pay attention to when "creating an index"?
随机推荐
GO语言-panic和recover
Drama asking Huamen restaurant Weng
Ams:startactivity desktop launch application
The propeller framework v2.3 releases the highly reusable operator library Phi! Restructure development paradigm to reduce cost and increase efficiency
九九乘法表.bat
Complete one-time GC process of JVM principle
Raspberry pie network remote access
Mysql入门学习(二)之子查询+关联
1010 Radix
pkav简单爆破
导出带水印的PDF
关于信息泄露和防御
PHP move_ uploaded_ File failed to upload mobile pictures
How to conduct exploratory data analysis
bat中获取bat命令结果
Memory model of JVM principle
VMware network connection error unit network service not found
[microservices | Nacos] list of issues related to the Nacos version
GO语言-自定义error
【微服务|Nacos】Nacos版本相关问题一览