当前位置:网站首页>Baidu map data visualization
Baidu map data visualization
2022-07-23 20:03:00 【Large American style without sugar】
How to use Baidu map
Go to Official documents Make a series of registrations , Mainly to obtain the service key :

newly build HTML file , Write sample code :
<!DOCTYPE html>
<html lang="en">

<head>
  <meta charset="UTF-8">
  <meta name="viewport" content="width=device-width, initial-scale=1.0">
  <title>Document</title>
  <style> html {
       height: 100%; } body {
       height: 100%; margin: 0px; padding: 0px; } #container {
       width: 400px; height: 400px; } .anchorBL, .BMap_cpyCtrl {
       display: none; /* Hide the official website watermark of Baidu map */ } </style>
</head>

<body>
  <!-- Create map container elements -->
  <div id="container"></div>
</body>
<!-- Quote Baidu map API file -->
<script type="text/javascript" src="https://api.map.baidu.com/api?v=1.0&type=webgl&ak=xnPUlI2jyZC0Rx61fa9OP9qzCTY3WTpH"></script>
<script> //  Create a map instance  var map = new BMapGL.Map("container"); //  Set the coordinates of the center point  var point = new BMapGL.Point(116.404, 39.915); //  Map initialization , At the same time, set the map display level  map.centerAndZoom(point, 15); </script>

</html>
Pictured , Quickly created a map centered on Tiananmen Square :

Load asynchronously
Use window.onload And Baidu map callback Parameter to implement , To reduce the first screen loading time :
<body>
  <div id="container"></div>
</body>
<!-- <script type="text/javascript" src="https://api.map.baidu.com/api?v=1.0&type=webgl&ak=xnPUlI2jyZC0Rx61fa9OP9qzCTY3WTpH"></script> -->
<script> function init() {
       var map = new BMapGL.Map("container"); var point = new BMapGL.Point(116.404, 39.915); map.centerAndZoom(point, 15); } window.onload = function() {
       var script = document.createElement('script'); // src  Add one more callback Parameters , Designated as init Method  script.src = 'https://api.map.baidu.com/api?v=1.0&type=webgl&ak=xnPUlI2jyZC0Rx61fa9OP9qzCTY3WTpH&callback=init'; document.body.appendChild(script); } </script>

</html>
3D Map
have access to heading and tilt Attribute controls the rotation angle and depression angle of the map
<script> function init() {
       var map = new BMapGL.Map("container"); var point = new BMapGL.Point(116.404, 39.915); map.centerAndZoom(point, 15); map.setHeading(30); map.setTilt(75); } window.onload = function() {
       var script = document.createElement('script'); script.src = 'https://api.map.baidu.com/api?v=1.0&type=webgl&ak=xnPUlI2jyZC0Rx61fa9OP9qzCTY3WTpH&callback=init' document.body.appendChild(script) } </script>

3D The earth
adopt setMapType(BMAP_EARTH_MAP) To open the earth view :
<script> function init() {
       var map = new BMapGL.Map("container"); var point = new BMapGL.Point(116.404, 39.915); map.centerAndZoom(point, 15); map.setHeading(0); map.setTilt(0); map.setMapType(BMAP_EARTH_MAP); } window.onload = function() {
       var script = document.createElement('script'); script.src = 'https://api.map.baidu.com/api?v=1.0&type=webgl&ak=xnPUlI2jyZC0Rx61fa9OP9qzCTY3WTpH&callback=init' document.body.appendChild(script) } </script>
This setMapType There are two constants in the method , One is BMAP_NORMAL_MAP , Ordinary street view . One is BMAP_EARTH_MAP, That is, the earth satellite view .

Baidu map control
Zoom in and out controls
Use the following code to introduce :
<script> function init() {
       var map = new BMapGL.Map("container"); var point = new BMapGL.Point(116.404, 39.915); map.centerAndZoom(point, 15); map.setMapType(BMAP_NORMAL_MAP); let zoomCtrl = new BMapGL.ZoomControl(); map.addControl(zoomCtrl); } window.onload = function() {
       var script = document.createElement('script'); script.src = 'https://api.map.baidu.com/api?v=1.0&type=webgl&ak=xnPUlI2jyZC0Rx61fa9OP9qzCTY3WTpH&callback=init' document.body.appendChild(script) } </script>

Adjust the position of the zoom in and zoom out components
Through to ZoomControl In the middle of offset Parameter to implement :
let zoomCtrl = new BMapGL.ZoomControl({

  anchor: BMAP_ANCHOR_BOTTOM_LEFT, //  Indicates that the control is located in the lower left corner of the map
  offset: new BMapGL.Size(0, 0) //  Control position offset
});

Adjust the maximum and minimum scaling
const map = new BMapGL.Map('container');
map.setMinZoom(8); // 3.0 Version not available
map.setMaxZoom(12); // 3.0 Version not available
// or
const map = new BMapGL.Map('container', {

  minZoom: 8,
  maxZoom: 12,
  mapType: BMAP_NORMAL_MAP
});
Scale control
var scaleCtrl = new BMapGL.ScaleControl({

  anchor: BMAP_ANCHOR_TOP_LEFT //  Without this default parameter, the scale bar will not be displayed
});
map.addControl(scaleCtrl);

Custom style
You can go to Baidu map Personalized maps Configure the color style you want :

You can use templates , You can also customize it yourself , Then click publish style :

Click publish to get a style ID, Copy it :

Then we can JavaScript API Map style has been applied in ( Be careful : released styleID Need and ak For the same user ):
map.setMapStyleV2({

  styleId: 'XXXXXXXXXXXXXXXXXXX'
});
Another way is by writing styles JSON How to file , Because the amount of data is relatively large and not intuitive , It is recommended to use style ID The way :

Baidu map drawing
draw icon
Marker Is a class that adds point markers to the traffic map . Use it to mark any points of interest you want users to see on the map .
API Provides the default icon style , You can also use Icon Class to specify custom icons .Marker The arguments to the constructor of are Point and MarkerOptions( Optional ).
Be careful : When you use custom icons , The geographical coordinate point of the annotation will be located at the center of the icon used for the annotation , You can go through Icon Of offset Attribute to modify the calibration position .
Define callout icons adopt Icon Class can realize the icon of custom annotation , The following example uses parameters MarkerOptions Of icon Property to set :
<script>
  var map = new BMapGL.Map("container");
  var point = new BMapGL.Point(116.404, 39.915);
  var myIcon = new BMapGL.Icon('./images/location.png', new BMapGL.Size(60, 60), {
    });
  //  Create dimension objects and add them to the map
  var marker = new BMapGL.Marker(point, {
    icon: myIcon});
  map.addOverlay(marker);
</script>

Draw line segments
The thickness of the stroke can be set separately for the broken line cover 、 Color 、 Fill color and other attributes :
var polyline = new BMapGL.Polyline([
  new BMapGL.Point(116.399, 39.910),
  new BMapGL.Point(116.405, 39.920),
  new BMapGL.Point(116.425, 39.900)
]);
map.addOverlay(polyline);

Like the previous icon drawing, there are many properties that can be configured , Details can be viewed official API file
Draw polygon
var polygon = new BMapGL.Polygon([
  new BMapGL.Point(116.387112, 39.920977),
  new BMapGL.Point(116.385243, 39.913063),
  new BMapGL.Point(116.394226, 39.917988)
], {

  strokeColor: "blue",
  strokeWeight: 2,
  strokeOpacity: 0.5,
  fillColor: 'pink'
});
map.addOverlay(polygon);

Text label
API Provides a default dimension style , It can also be done through setStyle To specify a custom style :
var content = " This is a text annotation ";
var label = new BMapGL.Label(content, {
     //  Create text annotation
  position: point, //  Set the geographic location of the dimension
  offset: new BMapGL.Size(10, 20) //  Set the offset of the dimension
});
map.addOverlay(label); //  Add annotations to the map
label.setStyle({
     //  Set up label The style of
  color: '#000',
  fontSize: '30px',
  border: '2px solid #1E90FF'
});

Information window
The information window is also a special cover , It can display richer text and multimedia information . Be careful : Only one information window can be opened on the map at a time
var opts = {

  width: 250, //  Information window width
  height: 100, //  Information window height
  title: "Hello" //  Message window title
}
var infoWindow = new BMapGL.InfoWindow("World", opts); //  Create information window object
map.openInfoWindow(infoWindow, map.getCenter()); //  Open the information window

What is often used is coordination marker Click to expand the window :
//  Create dimension objects and add them to the map
var marker = new BMapGL.Marker(point, {
    icon: myIcon});
map.addOverlay(marker);
var opts = {

  width: 250, //  Information window width
  height: 100, //  Information window height
  title: "Hello" //  Message window title
}
var infoWindow = new BMapGL.InfoWindow("World", opts); //  Create information window object
marker.addEventListener('click', function() {

  map.openInfoWindow(infoWindow, map.getCenter()); //  Open the information window
});

among InfoWindow The first parameter of can be passed directly in the form of string HTML:
var opts = {

  width: 250, //  Information window width
  height: 100, //  Information window height
  title: "Hello" //  Message window title
}
var content = '<div style="color:pink;">World</div>'; //  Pass in HTML
var infoWindow = new BMapGL.InfoWindow(content, opts);
marker.addEventListener('click', function() {

  map.openInfoWindow(infoWindow, map.getCenter());
});

Baidu Maps viewAnimation Animation
adopt new BMapGL.ViewAnimation(keyFrames, opts) To define an animation , among keyFrames Is an array , Key frames are defined , Keyframes are defined in the form of an array of objects , Each key frame is an object member of the array , Passed in as an object literal .
and opts Set animation properties , Animation attributes are defined in the form of an object , Each attribute corresponds to an attribute of the object .
And then through startViewAnimation Methods to start animation .
You can refer to Animation in official documents An example of , No more code here , In short, the animation effect is quite good , It is much better than using timing to complete animation .
Baidu Maps TrackAnimation Animation
Different from the previous viewAnimation Animation ,TrackAnimation Animation is trajectory animation , The previous animation is similar CSS Of keyFrames Animation .
Refer to the official documents for the same TrackAnimation Animation An example of
It should be noted that in the official documents v1.0 Of API did not TrackAnimation dependent , Using this animation requires the introduction of additional open source libraries BMapGLLib.TrackAnimation, This point is also mentioned in the document example .
Baidu map visualization ( Scatter plot 、 Flying line diagram, etc )
What we use here is MapVGL,MapVGL It's based on WebGL Geographic information visualization library , Can be used to show a large number of 3D Geographic information point, line and surface data . The original intention of the design is mainly to solve the problem of large amount of 3D geographic data display and some cool 3D effects .
For more effects, see Official documents
边栏推荐
- Leetcode 216. 组合总和 III
- Powercli moves virtual machines from host01 host to host02 host
- osgearth2.8编译siverlining云效果
- Adobe Acrobat two powerful plug-ins
- Leetcode 238. product of arrays other than itself
- LeetCode - 最接近的三数之和
- Robot decision-making system based on self-learning (daki technology, Zhao kaiyong)
- [hero planet July training leetcode problem solving daily] 23rd dictionary tree
- Energy principle and variational method note 12: minimum potential energy principle
- Construction deployment scheme of GPS Beidou clock server (NTP network clock system)
猜你喜欢

攻防世界web题-fakebook
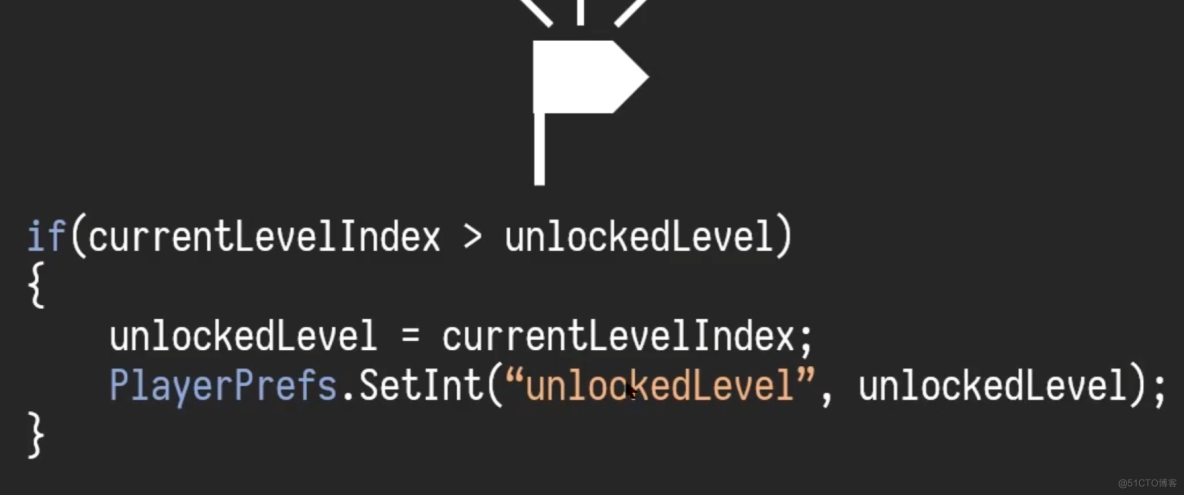
【Unity项目实践】关卡解锁

Leetcode 238. 除自身以外数组的乘积
![Relevant interfaces of [asp.net core] option mode](/img/2e/847e7541cfc49fd69794089dce2df2.jpg)
Relevant interfaces of [asp.net core] option mode

Meiker Studio - Huawei 14 day Hongmeng equipment development practical notes 4
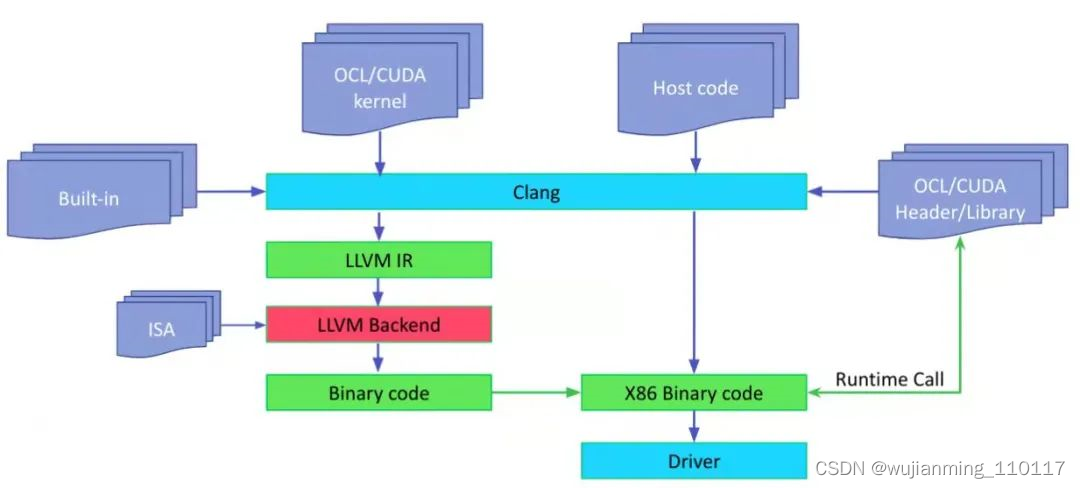
Compiler llvm MLIR introductions llvm backend instruction

Powercli management VMware vCenter one click batch deployment OVF

3D point cloud course (VII) -- feature point description

我在代码里面故意留个漏洞,违法吗?
The numerical sequence caused by the PostgreSQL sequence cache parameter is discontinuous with interval gap
随机推荐
C language leak detection and filling (1)
2022DASCTF MAY
Redux summation case explanation version tutorial
Powercli management VMware vCenter batch deployment export import
华为云HCS解决方案笔记HUAWEI CLOUD Stack【面试篇】
[PM2] PM2 common commands
phar反序列化
osgearth使用sundog公司的triton海洋和silverlining云彩效果
3D point cloud course (VII) -- feature point description
Codeforces round 809 (Div. 2) [VP record]
2022山东养老展,中国国际养老服务业展览会,济南老龄产业展
Powercli imports licensekey to esxi
Adobe Acrobat two powerful plug-ins
安装Win11找不到固态硬盘如何解决?
QT With OpenGL(帧缓存篇)
20. Valid Parentheses有效的括号
Meiker Studio - Huawei 14 day Hongmeng equipment development practical notes 4
Leetcode 151. invert words in strings
能量原理与变分法笔记17:广义变分原理(识别因子方法)
LeetCode - 最接近的三数之和