当前位置:网站首页>Introduction to the hardest core PWN in the whole network_ Graphic analysis
Introduction to the hardest core PWN in the whole network_ Graphic analysis
2022-06-25 04:48:00 【hercu1iz】
PWN
- order
- Linux Basic knowledge in the environment
- ELF File format
- paragraph (segment) And section (section)
- The organization and distribution of program data in memory
- Large endian and small endian storage
- Key registers
- Static links and dynamic links
- The scope of influence of common assembly instructions ( Keep in mind )
- intel and AT&T Assembly format
- Spill protection mechanism
- GOT(global offset table)| PLT(procedure linkage table)
- Let the cat out of the libc Address
- Tools
- ldd
- objdump
- readelf
- ROPgadget
- GCC
- GDB
- [ attach ] vim View file binary data
order
PWN Knowledge only repeats itself , Only through practice can we be familiar with . The following knowledge points are in LINUX The system environment is the main description (Windows It will be a little different ).
Linux Basic knowledge in the environment
from C The generation process from source code to executable file

Compiling and linking of programs
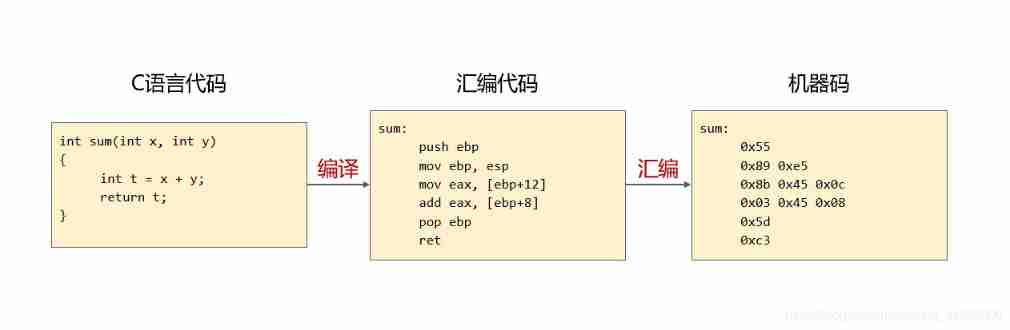
What is an executable

Executable file classification PE/ELF

ELF File format
attach : About LINUX(Linux Foundation Referenced Specifications)

The storage area that distinguishes sections and segments

load ELF / View section and segment distribution commands

notes : Here are two commands and to view the disk and memory respectively ELF Distribution of sections and segments .
View section distribution on disk :
objdump -s [elf file ]View segment distribution on memory process :
Method 1 :
May first ,./elf file &//& Background process suspended , Show pid
then ,cat /proc/[pid]/maps// View segment distributionMethod 2 :
gdb ./elf file// First gdb debuggingvmmap// View segment distribution
paragraph (segment) And section (section)

The organization and distribution of program data in memory

The above examples are for reference only . You can write one by yourself demo Then debug and check the corresponding information step by step .
Large endian and small endian storage

Key registers

The picture on the right is CSAPP Inside , It doesn't matter if you can't see clearly ( There's a lot of stuff on the Internet ),
The key is to understand the role of the three most important registers :
- RIP control CPU Execution instruction
- RSP,RBP Control function stack frame area (
Stack frameHere are two hard core articles , No more wheel building , Good resources must be fully utilized .)
C Language function call stack ( One )
C Language function call stack ( Two )
These two articles can help you get familiar with Function recursive call Detailed process , At the same time understand PWN The middle stack uses the most important knowledge — Stack frame . notes : These two articles are a little large for beginners , But don't lose heart , As long as you spend more time, you will be able to understand the general ( That's how I came here , When you want to give up, refer to stupid bloggers , I saw it many times . So you will always have more confidence , Ha ha ha .) The last point is that the best motivation to learn together is interest ( It has nothing to do with your IQ ), If you're not interested , It's better not to waste your time , There are so many choices in the world , It's best for you to find a direction you like .( Ha ha ha , Too philosophical , Let's get to the point )
Static links and dynamic links
- Static links
For example , You bought all the things you used , It belongs to you .

- Dynamic links
All the things I use are borrowed from others , Just borrow it from some places when you need it , Share with others .

The scope of influence of common assembly instructions ( Keep in mind )
leave Equivalent
mov esp, ebp;
pop ebpRETN Equivalent POP EIP; sub sp, n // It also balances the stack
change ESP and EIP(near)RETF Equivalent pop eip;pop cs
change EIP and CS(far)CALL Equivalent PUSH [EIP+ Hard coded number ]
change ESP and EIPJMP The essence only changes eip
intel and AT&T Assembly format
This is also explained in my other articles , Here is a simple comparison .
intel
opcode dst, src // The source and destination operation bits are the same as AT&T On the contraryAT&T
opcodel src, dst // At the same time, the first several registers %,l Represent long Long integer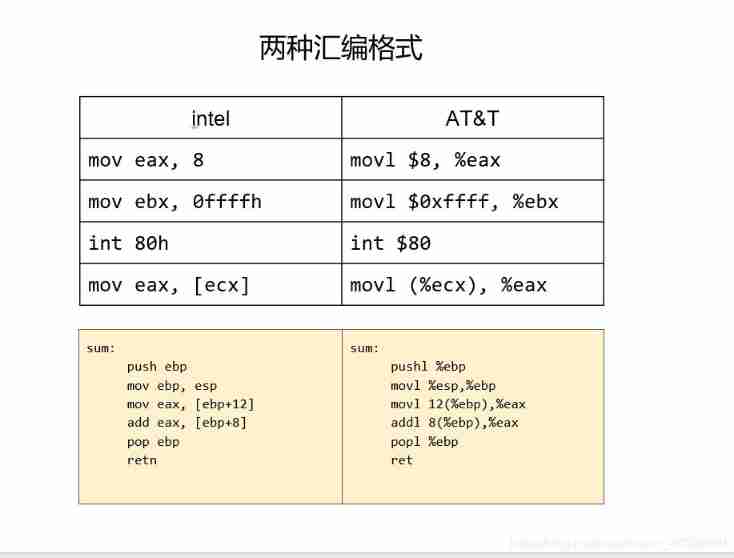
Spill protection mechanism
Fully understand the protection mechanism
1. LINUX Introduction to vulnerability mitigation mechanism
2. Recommended author , The analysis was very detailed , Article examples are attached to his article github In the link
PIE(Position-independent code)
- Every time you load ,
The base address of the programandlibc The base ofEverything has changed .
In calculation , Location independent code (PIC ) Or location independent executables (PIE) Is the body of the machine code , They are placed somewhere in main memory , Whatever its absolute address , Can be executed correctly .
PIC Commonly used for shared libraries , Therefore, the same library code can be loaded into each program address space without any other memory in use ( for example , Other shared libraries ) Overlapping position . PIC Also used for lack of MMU On older computer systems , therefore , Even without MMU Within a single address space of the system , The operating system can also keep applications away from each other .
Location independent code must use relative addressing .
ASLR(Address space layout randomization)
- Every time you load ,
libc The base ofchange .
Address space layout randomization (ASLR) It's a computer security technology , Can prevent the use of memory corruption vulnerabilities . To prevent an attacker from reliably jumping to a specific exploit function in memory ,ASLR Randomly arrange the address space position of the key data area of the process , Including the foundation of executable file and stack , Heap location And shared libraries .LINUX Close down ASLR
echo 0 > /proc/sys/kernel/randomize_va_space
NX bit (no-execute)
NX position ( Don't execute ) It's a program for CPU Technology , Used to separate memory areas , For processor instructions ( Code ) Storage or data storage uses , This feature is typically available only in Harvard architecture processors . however , For safety reasons ,NX Bits are increasingly used in conventional von Neumann Architecture processor .
DEP( Data Execution Prevention)
The system level memory protection function of the operating system . Mark the memory page as not executable .
RELRO(RELocation Read-Only, Read only relocation )
This mechanism has a startup level of partial startup and full startup .
Canary
against canary Strategy
1, Let the cat out of the canary value
2, Let the cat out of the fs:28H Internal value
3, overwrite fs:28H Copy value
4, hijacked stack_chk_fail
5,stack smashing
6, Burst byte by byte (BROP gadget, Relatively limited )
GOT(global offset table)| PLT(procedure linkage table)
GOT and PLT It is very important to understand the cause of vulnerability , At the same time, understanding is also very convoluted , Share your analysis of the great gods ( I hope you will support the sharing spirit of the authors )
1.GOT surface and PLT surface [ After reading this article, I basically do PWN You can understand the question ]
2. Here is a video explanation , To the students who are difficult to understand
3. Stack overflow of binary vulnerability mining - Turn on RELRO[ This analysis is very detailed , To deepen the LINUX Understanding of protection mechanisms , The understanding of the latter part requires a certain amount of knowledge accumulation ]
4.Linux Binary system ELF Program search symbol process analysis [ This article is similar to 3 similar , From the protection mechanism PLT and GOT The content of ]
Suggest : In order to deepen the understanding and impression , You'd better debug it step by step and follow it .
The process :
1,gdb Debug and see got surface , See which functions have not been loaded yet .
2, Take a look here PUTS function , Break down

3, Cut off si To follow up  4, Came to plt surface
5, Rerun , direct n Step over 
6, Keep looking. got surface
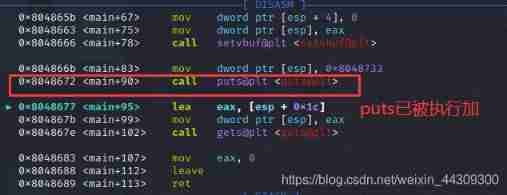
Has been filled in puts Real address 
7, Check it out plt The first one in the table jmp [got The address in the table ](0x804a014)

Conclusion :plt In the table ,jmp [ Address ].
The first time a function has not been loaded , Address =got Table address ( To find the real address of the function );
Second execution , Address = Function real address .
Let the cat out of the libc Address
principle : Dynamic linker , The functions contained in this program can not achieve the purpose that needs to be realized , Need help Dynamic link library The function in implements its purpose .
Find the dynamic link library information used
principle : Because in Paging mechanism , stay LINUX The system is based on 4k In units of , namely 12 position (2^12=4k), So use this rule , Even if the address randomization protection mechanism is enabled , Address of the Last three ( Offset in page ) It's the same .
The following figure illustrates : And then online libc Just Kucha
there offset All are The offset RVA. We also need to draw Base address =puts(VA) - puts(offset)
Online tools website 1
Online tools website 2
notes : Of course, there are other ways , As long as the goal is achieved .
Tools
ldd
1. summary >
ldd command Used to print a list of shared libraries that a program or library file depends on .
2. grammar >
ldd( Options )( Parameters )
Options
--version: Print instruction version number ;
-v: Detail mode , Print all relevant information ;
-u: Print unused direct dependencies ;
-d: Perform relocation and report any missing objects ;
-r: Perform relocation of data objects and functions , And report any missing objects and functions ;
--help: Display help information .
Parameters
file : Specify an executable program or library .
3. example >
The red mark is a soft link ( amount to win Next shortcut key )
Accessible /lib/x86_64-linux-gnu/ Under the table of contents command :file libc.so.6 View Link Properties
4. Additional description of the principle
First ldd Not an executable program , It's just one shell Script .
ldd Able to display executable modules dependency, The principle is to set a series of environment variables .
ldd Shows the executable module's dependency How it works , Its The essence It's through ld-linux.so(elf Dynamic library Loader ) To achieve . We know ,ld- linux.so Modules will precede executable Module program work , And gain control , Therefore, when the above environment variables are set ,ld-linux.so The display of executable modules is selected dependency.
In fact, it can be executed directly ld-linux.so modular , Such as :/lib/ld-linux.so.2 --list program( This is equivalent to ldd program)
objdump
objdump A bit like that quick view tool , It is to let you know more about the additional information that binary files may carry in a readable format . For programmers who just want to run their own programs , This command has no more meaning , For programmers who want to learn more about the system , You should master this tool , At least you can write it yourself shellcode 了 , Or take a look at what others give exploit Medium shellcode What is it? .
Common command options :
objdump -D -b binary -m i386 [file]
-D Represents disassembly of all files ;
-b For binary ;
-m Represents the instruction set architecture ;
file It is the binary file we want to disassemble ;
We can also specify big-endian or little-endian(-EB or -EL);
objdump -f [file] * Show file File header information for ;
objdump -t file * Output the... Of the target file The symbol table ;
objdump -h file * Show file Of Section Header Information ;
objdump -x file Show file All Header Information ;
-S file * Output the symbol table of the target file , When gcc -g Printing is more obvious ;[S Capitalization ]-s file Except to show file All Header Information , It also displays their corresponding hexadecimal file code ;
-d file * Disassembly file Those that need to execute instructions in section;-D file And -d similar , But disassembly file All in section;
-R * Display dynamic link relocation information ;-r Display relocation information ;
objdump -s libc.so>test.txt Output to txt file
- see PLT surface
objdump -d -j .plt file - see GOT surface
objdump -R file
notes :* The gang of No. 1 often use .
readelf
1. summary >
readelf command , Generally used to view ELF Format file information , Common files, such as in Linux The executable on , Dynamic library (.so) Or static libraries (.a) Etc ELF File format .
2. Common parameters > grammar :readelf ( Options )(file)-h (elf header), Show elf File header information at the beginning of the file .-l (program headers),segments Show program header ( Segment head ) Information ( If there's data ).-S (section headers),sections Display section header information ( If there's data ).-g (section groups), Display section group information ( If there's data ).-s (symbols) Displays the items in the symbol table segment ( If there's data ).-e headers Display all header information , Equivalent to : -h -l -S .-r relocs Displays information about relocatable segments .-d dynamic Display the information of the dynamic segment .-V version-info Displays information about the version segment .
attach : Command parameter reference :GNU Binary Utilities( English version )
ROPgadget
summary >
Find some required in the file Instructions and character string etc. .
Read the help manual
command :ROPgadget -h
Common commands
ROPgadget --binary [file] --string [...]	// Later, I will supplement it as needed , Here is another example of use
ROPgadget --binary  file name  --only "pop|ret" | grep rdi
GCC
Supplement relevant parameters of common protection
-no-pie: Turn off address randomization

-fno-stack-protector: Turn off stack protection

-z execstack: Stack executable

-m32:  Generate 32 Bit file
GDB
[ attach ] vim View file binary data
In command line mode :%!xxd [-g 1] convert to 16 In hexadecimal mode //[ ] Internal optional %!xxd -r Restore
边栏推荐
- 分布式websocket搭建方案
- Mongodb cluster
- How do the defi protocols perform under this round of stress test?
- Introduction to the isolation level of gbase 8s
- Kotlin Compose 监听软键盘 点击enter提交事件
- js的call()和apply()
- dotnet-exec 0.4.0 released
- What if the desktop computer is not connected to WiFi
- win11蓝牙无法连接怎么办?win11蓝牙无法连接的解决方法
- epplus复制模板后打印区域变小的问题
猜你喜欢

【无标题】

leetcode1221. Split balance string

【FLink】access closed classloader classloader. check-leaked-classloader

Separation of storage and computing in Dahua cloud native database

小白一键重装官网下载使用方法
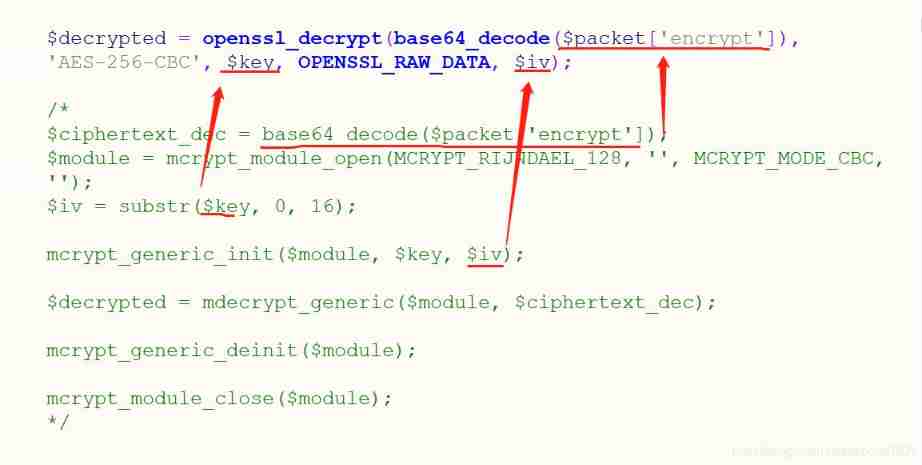
Upgrade PHP to php7 The impact of X (2), the obsolescence of mcrypt decryption

机器学习深度学习——向量化

The solution of wechat applet switchtab unable to take parameters

哪个编程语言实现hello world最烦琐?

dotnet-exec 0.4.0 released
随机推荐
Separation of storage and computing in Dahua cloud native database
Gbase 8s stored procedure syntax structure
The consciousness of a programmer
本轮压力测试下,DeFi协议们表现如何?
《QDebug 2022年6月》
win11蓝牙无法连接怎么办?win11蓝牙无法连接的解决方法
Basic introduction of gbase 8s blocking technology
halcon之区域:多种区域(Region)生成(3)
2.0SpingMVC使用RESTful
[Flink] problems and solutions of the continuous growth of checkpoint size in rocksdb incremental mode
为什么SQL语句命中索引比不命中索引要快?
How do the defi protocols perform under this round of stress test?
我的IC之旅——资深芯片设计验证工程师成长——“胡”说IC工程师完美进阶
Codeforces Round #802 (Div. 2) C D
Simple text analysis of malicious samples - Introduction
MySQL concept and operation (III)
大话云原生数据库中的存算分离
Gbase 8s stored procedure flow control
Wechat likes to pay attention to the solution of invalid automatic reply
Unity Quad culls shaders with back faces and transparent parts