当前位置:网站首页>II Data preprocessing
II Data preprocessing
2022-06-23 01:53:00 【I SONGFENG water month】
2.1 Exploratory data analysis
The crawled data is directly placed in csv The file can be read directly
Take crawling house data as an example
# !pip install seaborn pandas matplotlib numpy
import numpy as np
import pandas as pd # It can be used when there is little data pandas, When the data is large, you can make it smaller by sampling
import matplotlib.pyplot as plt
import seaborn as sns
from IPython import display
display.set_matplotlib_formats('svg')
# Alternative to set svg for newer versions
# import matplotlib_inline
# matplotlib_inline.backend_inline.set_matplotlib_formats('svg')
data = pd.read_csv('house_sales.zip') # Compressed into zip file , The text can be stored as a compressed file by default
data.shape
data.head()
null_sum = data.isnull().sum()
data.columns[null_sum < len(data) * 0.3]  # columns will keep
data.drop(columns=data.columns[null_sum > len(data) * 0.3], inplace=True)
data.dtypes
currency = ['Sold Price', 'Listed Price', 'Tax assessed value', 'Annual tax amount']
for c in currency:
    data[c] = data[c].replace(
        r'[$,-]', '', regex=True).replace(
        r'^\s*$', np.nan, regex=True).astype(float)
areas = ['Total interior livable area', 'Lot size']
for c in areas:
    acres = data[c].str.contains('Acres') == True
    col = data[c].replace(r'\b sqft\b|\b Acres\b|\b,\b','', regex=True).astype(float)
    col[acres] *= 43560
    data[c] = col
data.describe()
abnormal = (data[areas[1]] < 10) | (data[areas[1]] > 1e4)
data = data[~abnormal]
sum(abnormal)
ax = sns.histplot(np.log10(data['Sold Price']))
ax.set_xlim([3, 8])
ax.set_xticks(range(3, 9))
ax.set_xticklabels(['%.0e'%a for a in 10**ax.get_xticks()]);
data['Type'].value_counts()[0:20]
types = data['Type'].isin(['SingleFamily', 'Condo', 'MultiFamily', 'Townhouse'])
sns.displot(pd.DataFrame({
    'Sold Price':np.log10(data[types]['Sold Price']),
                          'Type':data[types]['Type']}),
            x='Sold Price', hue='Type', kind='kde');
data['Price per living sqft'] = data['Sold Price'] / data['Total interior livable area']
ax = sns.boxplot(x='Type', y='Price per living sqft', data=data[types], fliersize=0)
ax.set_ylim([0, 2000]);
d = data[data['Zip'].isin(data['Zip'].value_counts()[:20].keys())]
ax = sns.boxplot(x='Zip', y='Price per living sqft', data=d, fliersize=0)
ax.set_ylim([0, 2000])
ax.set_xticklabels(ax.get_xticklabels(), rotation=90);
_, ax = plt.subplots(figsize=(6,6))
columns = ['Sold Price', 'Listed Price', 'Annual tax amount', 'Price per living sqft', 'Elementary School Score', 'High School Score']
sns.heatmap(data[columns].corr(),annot=True,cmap='RdYlGn', ax=ax);
2.2 Data cleaning
How to improve data quality ? Data cleaning
The data is noisy : Data cleaning
The data is clean but not in the desired format : Data transformation
Data is not model friendly : Data Extraction
Noise in the data may cause the model to become worse and worse
Common data errors :
1. The data is not in the normal distribution
2. Data conflicts with some rules
3. Wrong data type or semantics
2.3 Data conversion
Data transformation
Collect the marked original data Data transformation ——> Data characteristics ——> model training
Common data transformation means :
1. Limit the maximum and minimum values of the data to an interval 
2. Standardization 
3. normalization ( Less use )
4.log Transformation ( Consider when the data is large log Transformation )
The cost of crawling and storing pictures is relatively high , How to deal with pictures ?
Down sample the picture , So the commonly used training image databases are 224*224 size , There is a trade-off between data quality and data size .
How to deal with video ?
Sample the video , Not every frame is sampled .
Text data processing : Sub word
summary : Data conversion , You convert the data into the format required for machine learning , Balance the quality and size of data , What format is used to store , Video sampling , Pictures can be down sampled , Text can be grammatical , Sub CI Hua .
2.4 Feature Engineering
Turn the data into what the model likes
边栏推荐
- You can be what you want to be
- The devil cold rice # 099 the devil said to travel to the West; The nature of the boss; Answer the midlife crisis again; Specialty selection
- Arm assembly syntax
- 1. Mx6u bare metal program (5) - external interrupt
- Initial structure
- SQL programming task06 assignment - Autumn recruit secret script ABC
- Time complexity
- C. Unstable String
- Autumn move script C
- 3. compilation and linking principle
猜你喜欢

The devil cold rice # 099 the devil said to travel to the West; The nature of the boss; Answer the midlife crisis again; Specialty selection

Classical questions of function recursion

Constexpr keyword

C language games: sanziqi (simple version) implementation explanation

Unique in Pimpl_ PTR compilation errors and Solutions

JS - single sign on
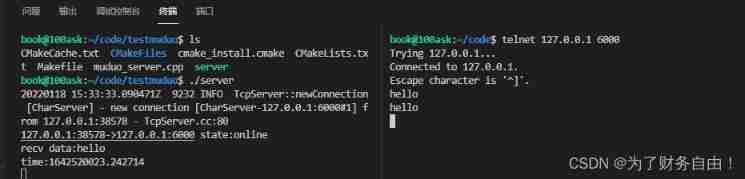
Muduo simple usage

7.new, delete, OOP, this pointer

office2016+visio2016

Detailed explanation of makefile usage
随机推荐
//1.13 auto increment and auto decrement operators (+ +, --)
Three methods for solving Fibonacci sequence feibonacci (seeking rabbit) - program design
Use of higher order functions
Freshman C language summary post (hold change) Part1 output diamond
C serializabledictionary serialization / deserialization
Analysis of current mainstream video coding technology | community essay solicitation
Pat class A - 1007 maximum subsequence sum
[hdu] p1466 calculate the number of intersections of straight lines
2D prefix and
C language foundation ----- write a function to find the larger value of two unequal integers
Ch340 and PL2303 installation (with link)
"First knowledge of C language" (Part 3)
Autumn move script B
office2016+visio2016
Classical questions of function recursion
Pat class a 1016 phone bills (time difference)
//1.11 basic operators
Char[], char *, conversion between strings
Network module packaging
JS - single sign on