当前位置:网站首页>maptalks:数据归一化处理与分层设色图层加载
maptalks:数据归一化处理与分层设色图层加载
2022-06-24 19:03:00 【似曾不相识】
功能需求
在地图功能开发过程中,有根据区划统计数值,实现分层设色的需求。如:有以下人口总数统计数据(其中AREA表示行政区划编码,POPDENSITY表示人口总数数值),现在需要根据人口总数,实现分层设色,来对人口空间分布特征进行可视化展示。
{

    "msg": "返回成功",
    "data": [
        {
     "AREA": "310101", "POPDENSITY": 32295 },
        {
     "AREA": "310104", "POPDENSITY": 20177 },
        {
     "AREA": "310105", "POPDENSITY": 18651 },
        {
     "AREA": "310106", "POPDENSITY": 26533 },
        {
     "AREA": "310107", "POPDENSITY": 22325 },
        {
     "AREA": "310109", "POPDENSITY": 32387 },
        {
     "AREA": "310110", "POPDENSITY": 20517 },
        {
     "AREA": "310112", "POPDENSITY": 7115 },
        {
     "AREA": "310113", "POPDENSITY": 7407 },
        {
     "AREA": "310114", "POPDENSITY": 3960 },
        {
     "AREA": "310115", "POPDENSITY": 4071 },
        {
     "AREA": "310116", "POPDENSITY": 1356 },
        {
     "AREA": "310117", "POPDENSITY": 3158 },
        {
     "AREA": "310118", "POPDENSITY": 1902 },
        {
     "AREA": "310120", "POPDENSITY": 1597 },
        {
     "AREA": "310151", "POPDENSITY": 470 }
    ]
}
实现思路
色带选取
分层设色,实质上就是根据不同的权重值,来选择不同轻重程度的数量值,通过颜色的变化,来反映数值的变化。映射到地理空间,就是为了展示数值在空间分布上的变化情况。色带如何选择?可以点击此处,通过Color Blender在线工具生成。以下是我设计的色带,对应的颜色代码数组如下,长度为10,
  const colortable_3 = [
            "#FFFFCC",
            "#FFF1B9",
            "#FFE3A7",
            "#FFD594",
            "#FFC782",
            "#FFB96F",
            "#FFAC5D",
            "#FF9E4A",
            "#FF9038",
            "#FF8225",
            "#FF7413",
            "#FF6600"
        ]

数据处理
如何将统计数据映射到色彩空间呢?由于色带数组长度为10,所以,可以先将原始数据做归一化处理,再将处理结果乘以10,向下取整,将计算结果作为colortable_3 数组的下标索引值,取到对应的16进制颜色代码。
通过上述先归一化、再缩放的处理方式,即可将原始数据的变化映射到色彩空间的颜色变化。
计算公式如下,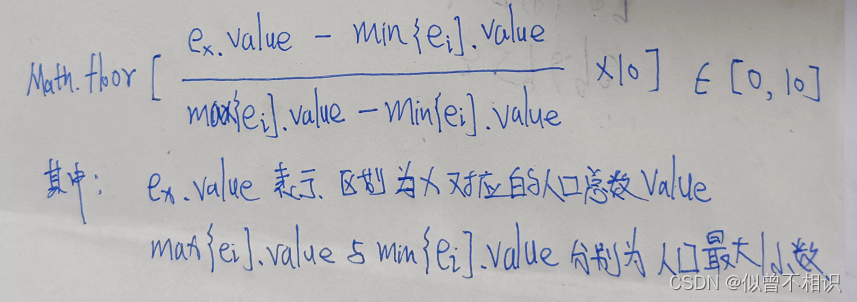
核心代码
对应的核心计算代码,实现如下,
  /** * 加载上海市行政区划图-人口密度分层设色图 * */
    function loadSH_map(_map, _layerName, _dataSource, _boundValue, _colorTable = colortable_1) {

        let collection = new Array();
        // 遍历_dataSource数据源-重新设置symbol属性值
        _dataSource.some(function(value, index, array) {

            //获取行政区划编码
            let code = value.properties.adcode;
            //根据code获取对应的NUM值
            let curValue = getValueByAreaCode(code, _boundValue);
            //计算归一化值-整型数值
            let normalizationValue = Math.floor((curValue.POPDENSITY - _boundValue.min.POPDENSITY) / (_boundValue.max.POPDENSITY - _boundValue.min.POPDENSITY) * (_colorTable.length - 1));
            console.log(normalizationValue)
                //获取颜色表取值
            let fillColor = _colorTable[normalizationValue];
            //获取坐标数组
            let coordinates = value.geometry.coordinates;
            console.log(coordinates)
                //构造polygon多边形对象
            let polygon = new maptalks.MultiPolygon(coordinates, {

                visible: true,
                editable: true,
                cursor: 'pointer',
                shadowBlur: 0,
                shadowColor: 'black',
                draggable: false,
                dragShadow: false, // display a shadow during dragging
                drawOnAxis: null, // force dragging stick on a axis, can be: x, y
                symbol: {

                    'lineColor': '#34495e',
                    'lineWidth': 2,
                    'polygonFill': fillColor,
                    'polygonOpacity': 1
                }
            });
            collection.push(polygon);
        })
        new maptalks.VectorLayer('vector', new maptalks.GeometryCollection(collection))
            .addTo(_map);

    }

    /** * 根据行政区划编码获取对应的NUM值 * */
    function getValueByAreaCode(_code, _boundValue) {

        let result = boundValue.min;
        for (let i = 0; i < polulation.length; i++)
            if (polulation[i].AREA == _code) {

                result = polulation[i];
                break;
            }
        return result;
    }
完整示例代码
以下为完整代码实现,如何对地理空间进行可视化呢?在此,选用maptalks二三维一体可视化平台,示例代码如下,
<!DOCTYPE html>
<html lang="en">
<head>
<meta charset="UTF-8">
<meta http-equiv="X-UA-Compatible" content="IE=edge">
<meta name="viewport" content="width=device-width, initial-scale=1.0">
<title>上海市分层设色</title>
<!-- style内联样式 -->
<style type="text/css">
html,
body {
margin: 0px;
height: 100%;
width: 100%
}
.container {
width: 100%;
height: 100%;
}
/* 隐藏maptalks底部文字属性 */
.maptalks-attribution {
display: none;
}
</style>
<!-- 引入maptalks资源 -->
<link href="./plugins/maptalks.css" />
<script src="./plugins/maptalks.js"></script>
<!-- jquery -->
<script src="./plugins/jquery-3.2.1.min.js"></script>
<!-- 引入arcgis开发包 -->
<script src="./plugins/arcgis/maptalks.arcgis.min.js"></script>
</head>
<body>
<div id="map" class="container"></div>
</body>
<script>
//创建基础图层
let baseLayer = new maptalks.TileLayer('base', {
urlTemplate: 'https://{s}.basemaps.cartocdn.com/light_all/{z}/{x}/{y}.png',
subdomains: ['a', 'b', 'c', 'd'],
// attribution: '© <a href="http://osm.org">OpenStreetMap</a> contributors, © <a href="https://carto.com/">CARTO</a>',
// css filter
cssFilter: 'sepia(100%) invert(90%)',
opacity: 0.95, // TileLayer's opacity, 0-1
})
//初始化maptalks
var map = new maptalks.Map('map', {
center: [121.467, 31.0334],
zoom: 10,
minZoom: 1, // set map's min zoom to 14
maxZoom: 14, // set map's max zoom to 14
// 拖动倾斜旋转参数
//allow map to drag pitching, true by default
dragPitch: true, //禁用抬起/相机pitch角度切换
//allow map to drag rotating, true by default
dragRotate: true, //false-禁用旋转
//enable map to drag pitching and rotating at the same time, false by default
dragRotatePitch: true, //
doubleClickZoom: false, //取消鼠标双击放大效果
baseLayer: baseLayer,
});
//挂载图层
map.configLayers = {
base_layer: baseLayer, //基础底图图层
sh_layer: undefined, //基础矢量图层
hhypsometric_layer: undefined, //热力图图层
};
//颜色表
const colortable_3 = [
"#FFFFCC",
"#FFF1B9",
"#FFE3A7",
"#FFD594",
"#FFC782",
"#FFB96F",
"#FFAC5D",
"#FF9E4A",
"#FF9038",
"#FF8225",
"#FF7413",
"#FF6600"
]
//获取人口数据+上海行政区划数据
let polulation = getDataSource("people_num").data;
let sh_dataSource = getDataSource("shanghai").features
let sh_textSource = getDataSource("shanghai");
//获取人口边界数据
let boundValue = deal_populationData(polulation)
//加载sh行政区划数据
loadSH_map(map, "sh_layer", sh_dataSource, boundValue, colortable_3);
//文字注记
initMarker(map, sh_textSource);
/** * 初始化中心标记点 * */
function initMarker(_map, _dataSource) {
//json转为geometry
let geometries = maptalks.GeoJSON.toGeometry(_dataSource);
let shptArray = new Array();
//遍历geometries-添加中心标记点
geometries.some(function(value, index, array) {
let properties = value.properties; //获取属性数据
shptArray.push(
new maptalks.Marker(properties.center, {
id: properties.name,
visible: true,
editable: true,
cursor: 'pointer',
shadowBlur: 0,
shadowColor: 'black',
draggable: false,
dragShadow: false, // display a shadow during dragging
drawOnAxis: null, // force dragging stick on a axis, can be: x, y
symbol: {
'textFaceName': 'sans-serif',
'textName': properties.name,
'textFill': '#fffff',
'textHorizontalAlignment': 'right',
'textSize': 16
},
properties: {
altitude: 2500,
properties: properties
}
})
)
})
//创建geometryCollection集合
//添加marker集合到VectorLayer中
new maptalks.VectorLayer('vector_Marker', new maptalks.GeometryCollection(shptArray, {
})).addTo(_map);
}
/** * 加载上海市行政区划图-人口密度分层设色图 * */
function loadSH_map(_map, _layerName, _dataSource, _boundValue, _colorTable = colortable_1) {
let collection = new Array();
// 遍历_dataSource数据源-重新设置symbol属性值
_dataSource.some(function(value, index, array) {
//获取行政区划编码
let code = value.properties.adcode;
//根据code获取对应的NUM值
let curValue = getValueByAreaCode(code, _boundValue);
//计算归一化值-整型数值
let normalizationValue = Math.floor((curValue.POPDENSITY - _boundValue.min.POPDENSITY) / (_boundValue.max.POPDENSITY - _boundValue.min.POPDENSITY) * (_colorTable.length - 1));
console.log(normalizationValue)
//获取颜色表取值
let fillColor = _colorTable[normalizationValue];
//获取坐标数组
let coordinates = value.geometry.coordinates;
console.log(coordinates)
//构造polygon多边形对象
let polygon = new maptalks.MultiPolygon(coordinates, {
visible: true,
editable: true,
cursor: 'pointer',
shadowBlur: 0,
shadowColor: 'black',
draggable: false,
dragShadow: false, // display a shadow during dragging
drawOnAxis: null, // force dragging stick on a axis, can be: x, y
symbol: {
'lineColor': '#34495e',
'lineWidth': 2,
'polygonFill': fillColor,
'polygonOpacity': 1
}
});
collection.push(polygon);
})
new maptalks.VectorLayer('vector', new maptalks.GeometryCollection(collection))
.addTo(_map);
}
/** * 根据行政区划编码获取对应的NUM值 * */
function getValueByAreaCode(_code, _boundValue) {
let result = boundValue.min;
for (let i = 0; i < polulation.length; i++)
if (polulation[i].AREA == _code) {
result = polulation[i];
break;
}
return result;
}
//人口数据处理
function deal_populationData(_population) {
let boundValue = {
};
let minTemp = _population[0],
maxTemp = _population[0];
//计算最大最小值
_population.some(function(value, index, array) {
minTemp.POPDENSITY > value.POPDENSITY ? minTemp = value : "";
maxTemp.POPDENSITY < value.POPDENSITY ? maxTemp = value : "";
})
return boundValue = {
min: minTemp,
max: maxTemp
}
}
/** * 获取数据源 * */
function getDataSource(_dataSource) {
let dataSource = undefined;
$.ajax({
url: "./data/" + _dataSource + ".json",
method: "GET",
async: false,
success: function(result, text, xhr) {
//GeoJSON utilities-Convert one or more GeoJSON objects to geometry
dataSource = result;
}
});
return dataSource;
}
</script>
</html>
最终效果
最终显示效果如下,
边栏推荐
- C language to realize mine sweeping (simple version)
- 消息称腾讯正式宣布成立“XR”部门,押注元宇宙;谷歌前 CEO:美国即将输掉芯片竞争,要让台积电、三星建更多工厂...
- 1、 Downloading and installing appium
- Maps are grouped according to the values of the passed in parameters (similar to database groupby)
- What is CNN (convolutional neural network)
- Behind Tiantian Jianbao storm: tens of millions in arrears, APP shutdown, and the founder's premeditated plan to run away?
- Popupwindow touch event transparent transmission scheme
- Bytebase rejoint la communauté de base de données open source d'alicloud polardb
- "Ningwang" was sold and bought at the same time, and Hillhouse capital has cashed in billions by "selling high and absorbing low"
- Making startup U disk -- Chinese cabbage U disk startup disk making tool V5.1
猜你喜欢

Docker installing Oracle

Apple doesn't need money, but it has no confidence in its content

Bytebase joins Alibaba cloud polardb open source database community

顺序栈1.0版本
Bytebase 加入阿里云 PolarDB 开源数据库社区

Basic operation of sequence table

Where are Xiaomi mobile phone's favorite SMS and how to delete them

图的基本概念以及相关定义

Uninstall tool v3.5.10.5670 single file portable official version

Confirm whether the host is a large terminal or a small terminal
随机推荐
对“宁王”边卖边买,高瓴资本“高抛低吸”已套现数十亿
Vxlan and MPLS: from data center to Metro Ethernet
Material management system based on SSM (source code + document + database)
"Super point" in "Meng Hua Lu", is the goose wronged?
托管服务与SASE,纵享网络与安全融合 | 一期一会回顾
苹果不差钱,但做内容“没底气”
CVPR 2022 remembers Sun Jian! Tongji and Ali won the best student thesis award, and hekaiming was shortlisted
Internet of things? Come and see Arduino on the cloud
Bytebase joins Alibaba cloud polardb open source database community
物聯網?快來看 Arduino 上雲啦
Accurate calculation of task progress bar of lol mobile game
With its own cells as raw materials, the first 3D printing ear transplantation was successful! More complex organs can be printed in the future
“拯救”直播带货,一个董宇辉还不够
unity之模糊背景(带你欣赏女人的朦胧美)
Coinbase将推出首个针对个人投资者的加密衍生产品
[suggested collection] time series prediction application and paper summary
Design of routing service for multi Activity Architecture Design
年轻人捧红的做饭生意经:博主忙卖课带货,机构月入百万
When querying the database with Gorm, reflect: reflect flag. mustBeAssignable using unaddressable value
Ribbon源码分析之@LoadBalanced与LoadBalancerClient