当前位置:网站首页>Rancher2.6全新Monitoring快速入门
Rancher2.6全新Monitoring快速入门
2022-06-23 17:19:00 【RancherLabs】
作者简介
万绍远,CNCF 基金会官方认证 Kubernetes CKA&CKS 工程师,云原生解决方案架构师。对 ceph、Openstack、Kubernetes、prometheus 技术和其他云原生相关技术有较深入的研究。参与设计并实施过多个金融、保险、制造业等多个行业 IaaS 和 PaaS 平台设计和应用云原生改造指导。
| 软件 | 版本 |
|---|---|
| Rancher | 2.6.4 |
| Kubernetes | 1.22.7+rke2r2 |
概 述
Rancher 2.6 监控启用方式与之前版本存在较大差异,属于原生的 Prometheus-Operator,通过抽象化一些 Kubernetes CRD 资源,可以更好地把监控告警功能整合起来,提高易用性。Prometheus-operator 包括以下 CRD 资源对象:
- PrometheusRules:定义告警规则
- Alert Managers:Altermanager 启动 CRD,用于 Altermanager 启动副本
- Receivers:配置告警接收媒介 CRD
- Routers:将告警规则和告警媒介进行匹配
- ServiceMonitor:定义 Prometheus 采集的监控指标地址
- Pod Monitor:更细粒化的对 POD 进行监控

配置使用
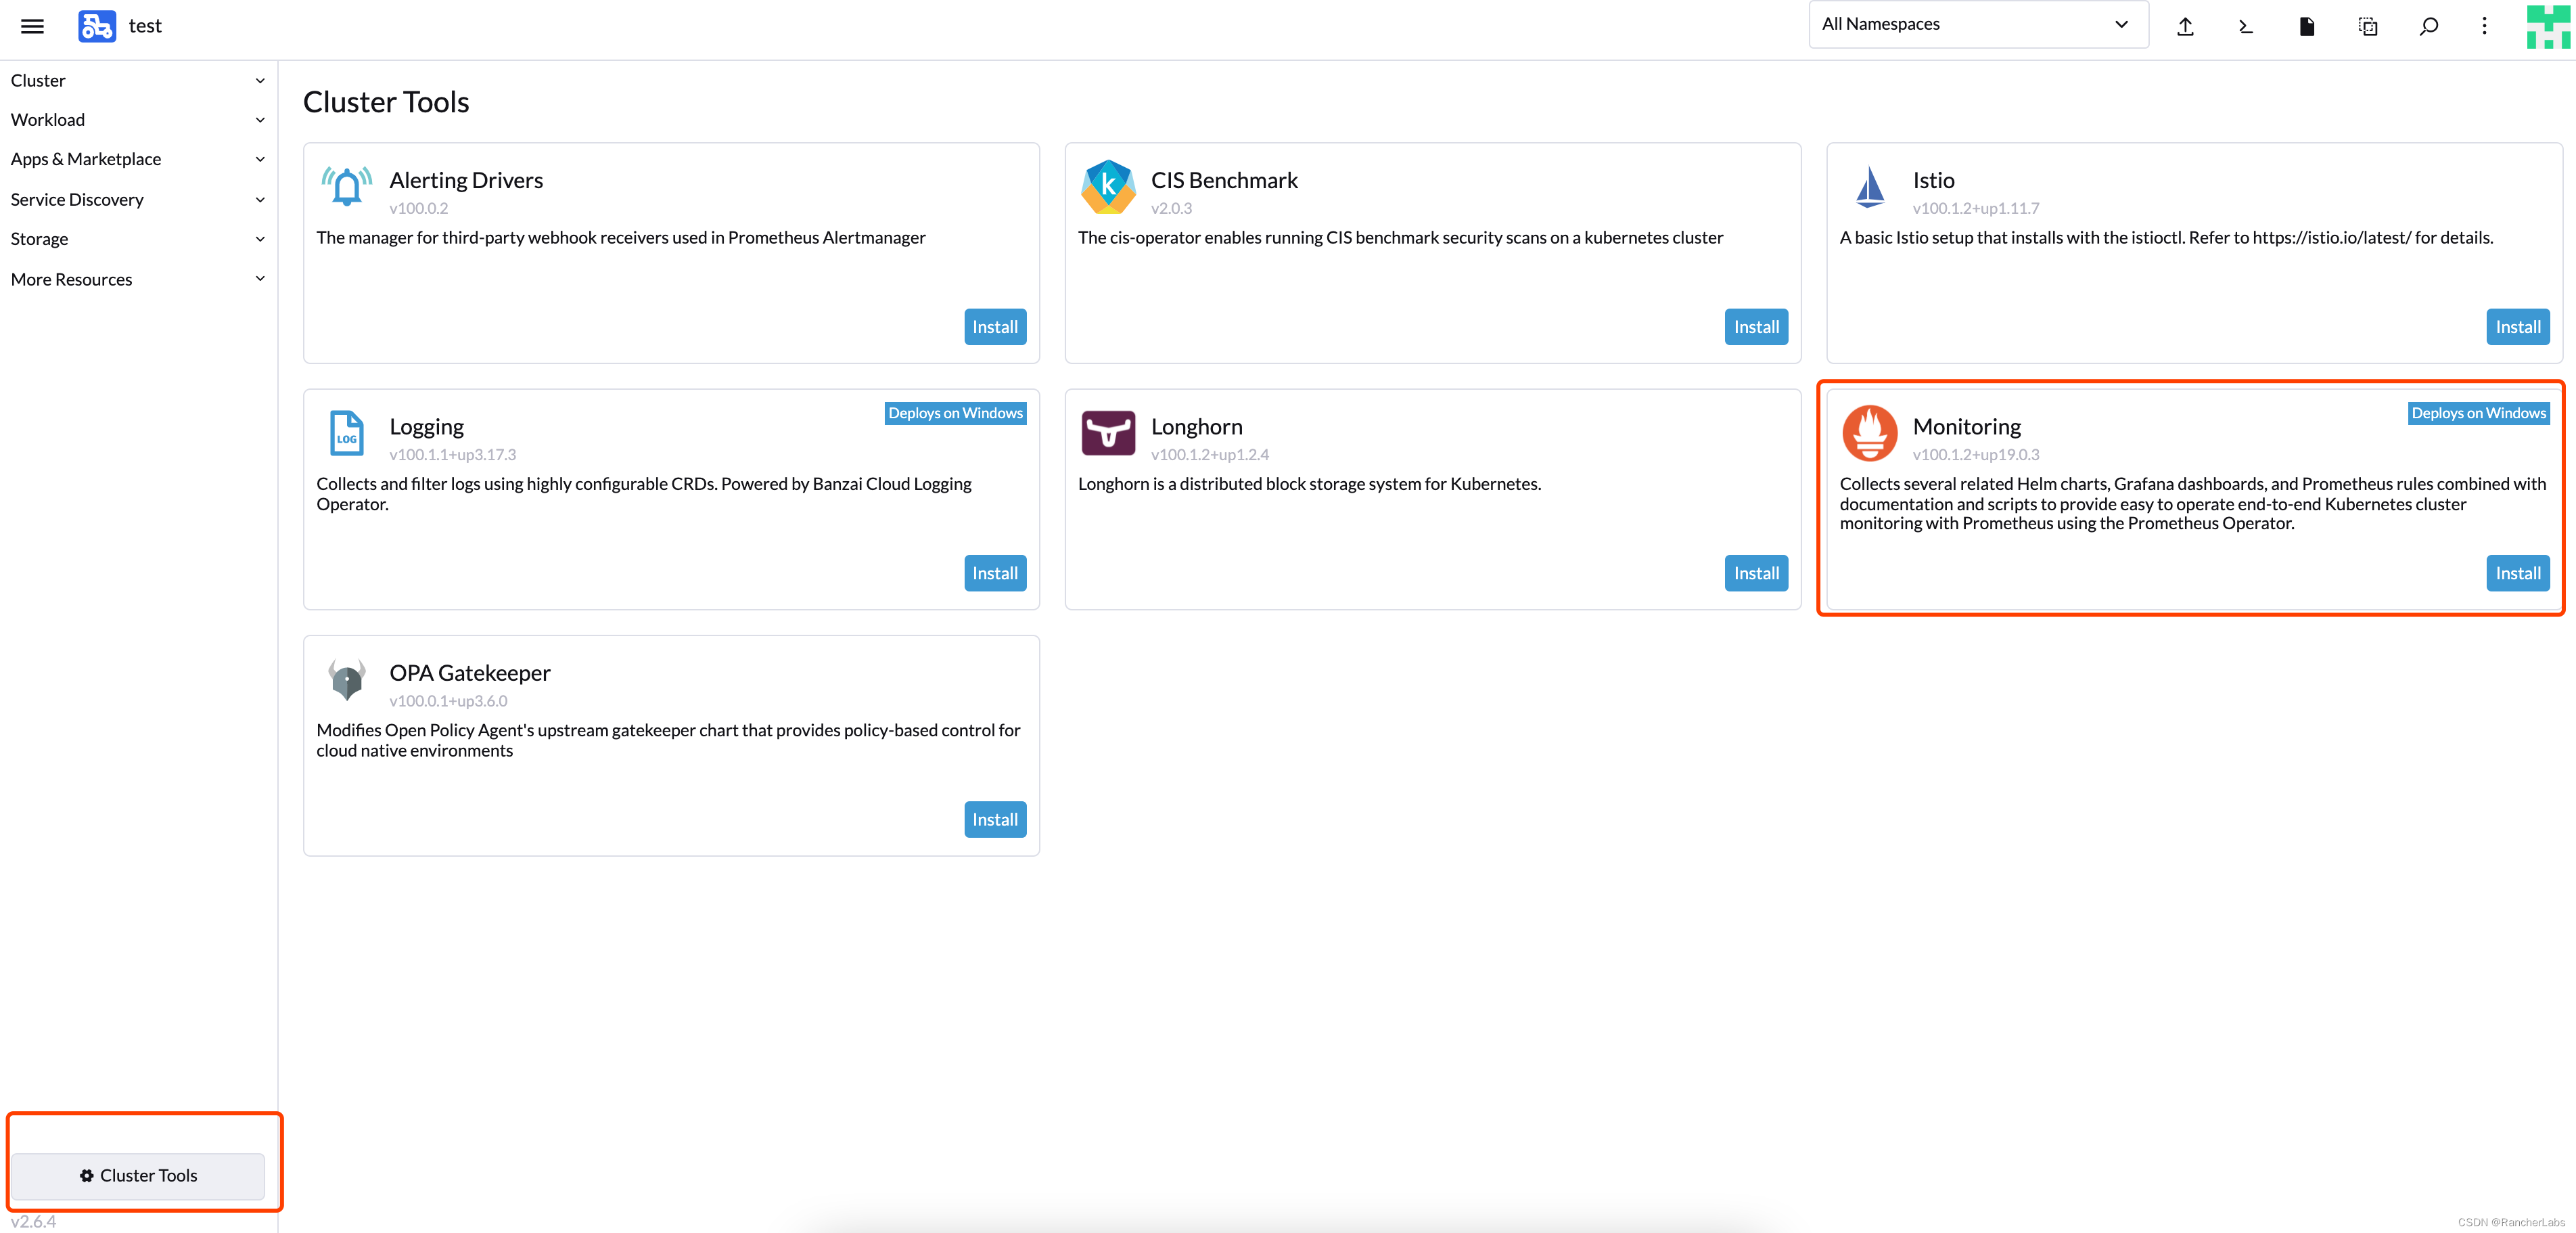
启用监控
切换到对应集群,选择左下角 clusterTools 启用 Prometheus:
部署到 System 项目中,勾选自定义 helm 参数:
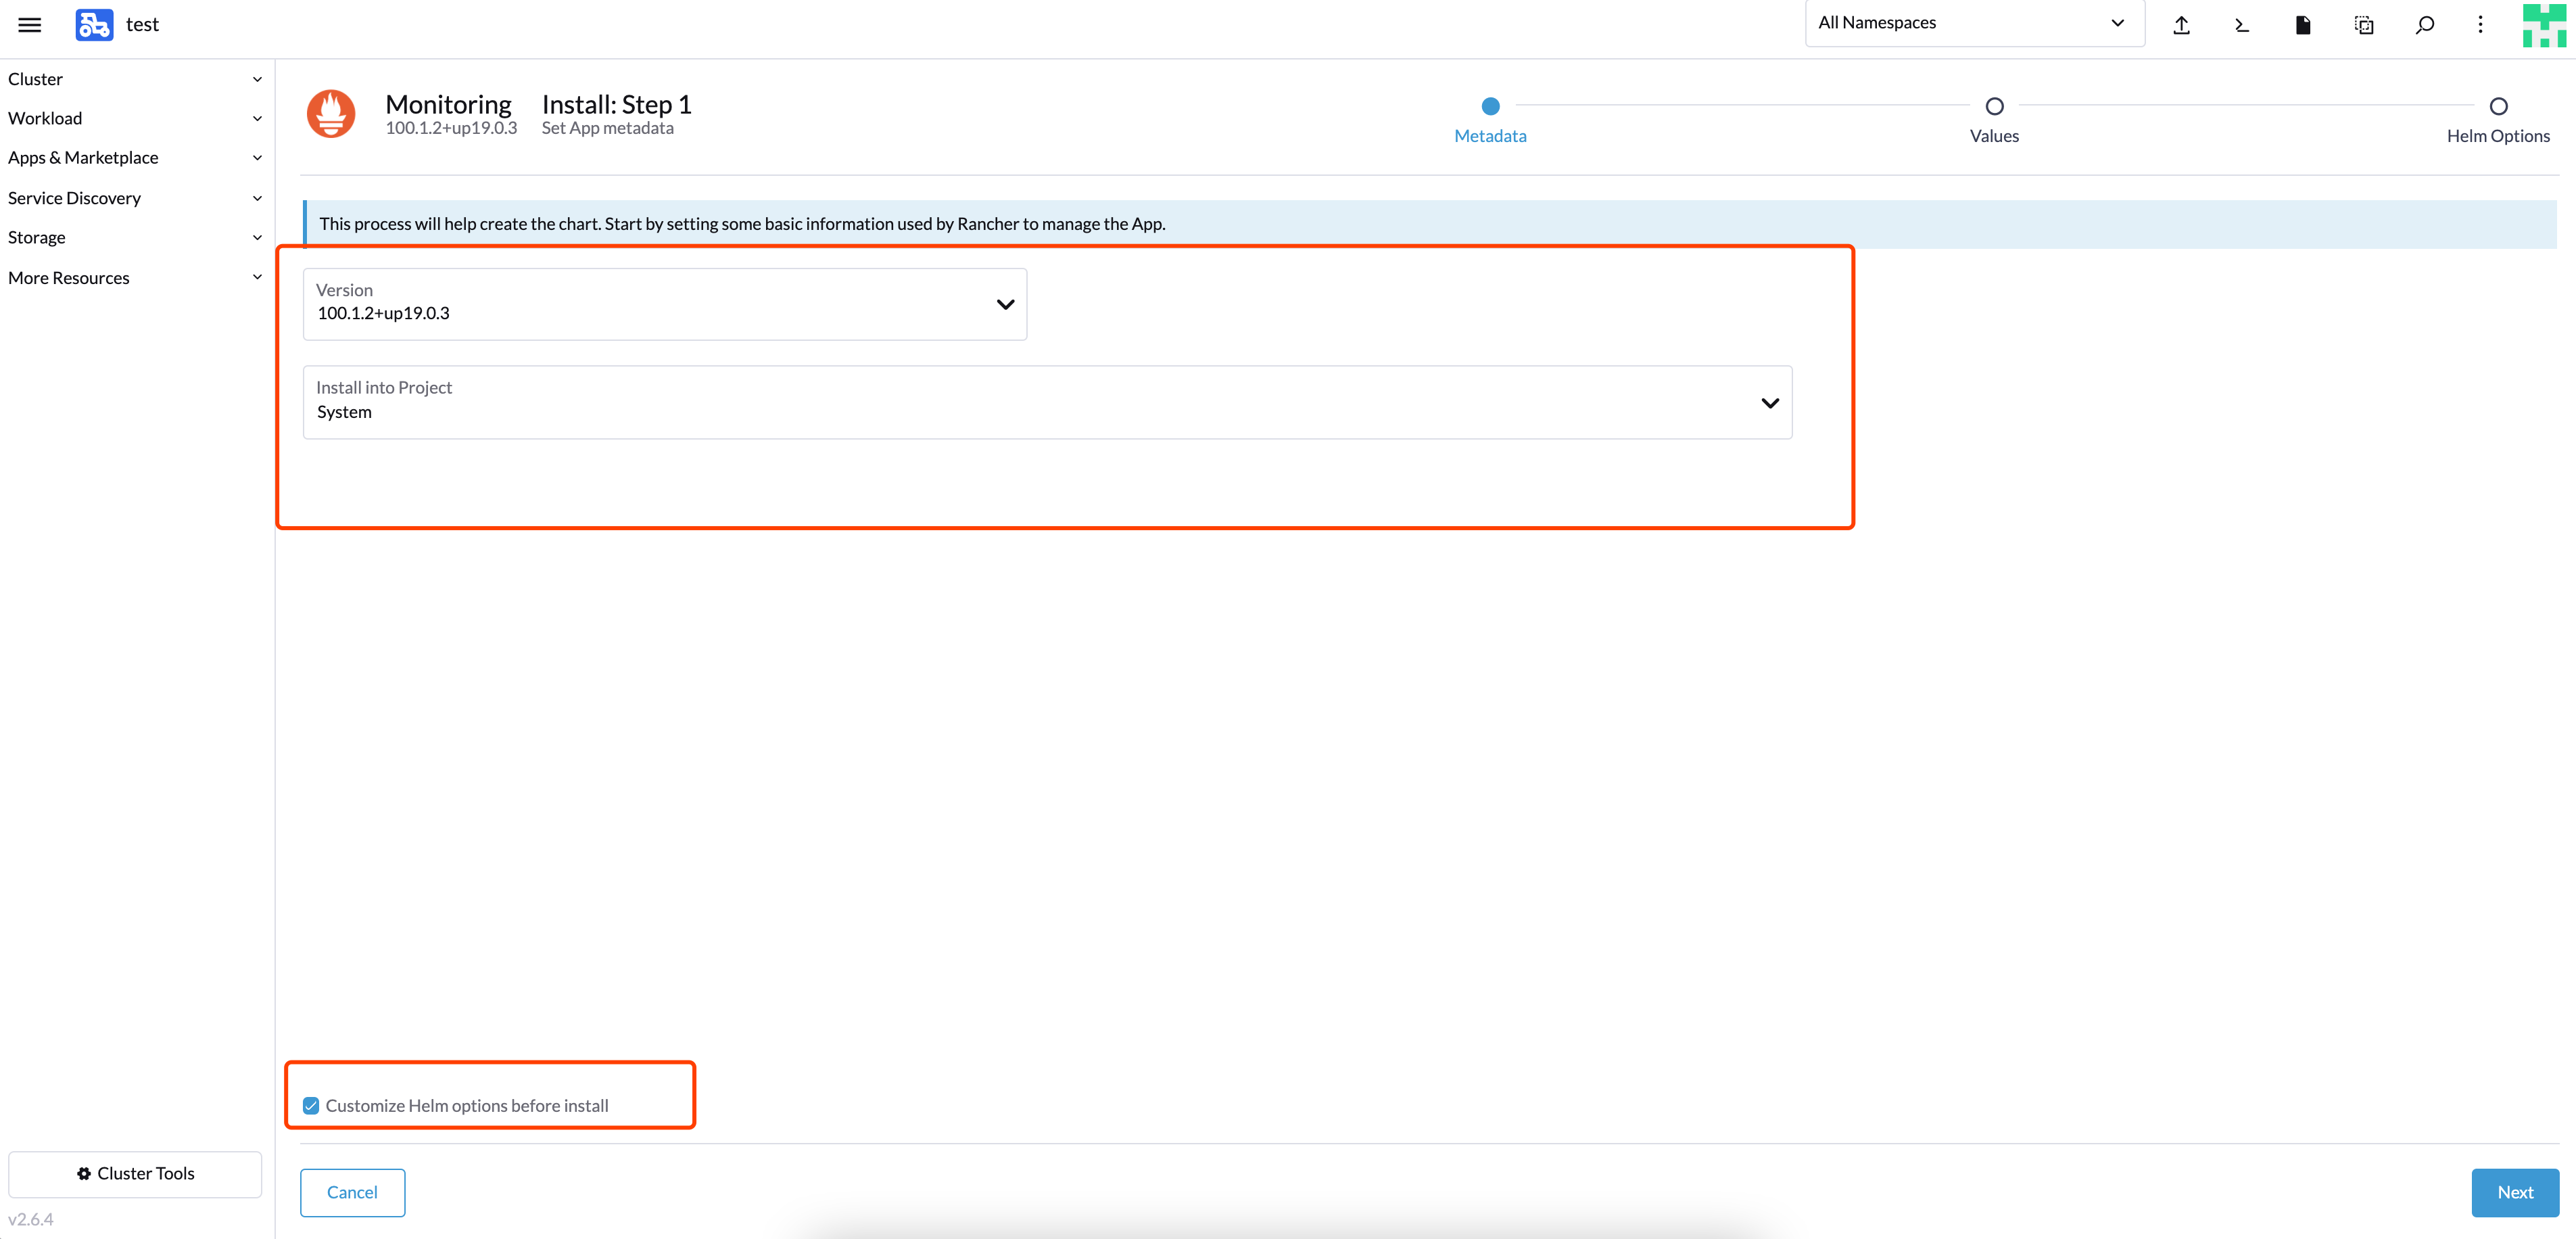
根据实际需求修改部署要求:


如果需要对接远端存储(如 infuxdb),就需要修改 yaml 配置,并配置指向 influxdb:
remoteRead: - url: http://192.168.0.7:8086/api/v1/prom/read?db=prometheusremoteWrite: - url: http://192.168.0.7:8086/api/v1/prom/write?db=prometheus默认 node-exporter 资源 limit 配置较低,长时间运行后容易被 OOM KILL 掉,需要修改默认的内存限制为 150Mi:
podLabels: jobLabel: node-exporter resources: limits: cpu: 200m memory: 150Mi requests: cpu: 100m memory: 30Mi可以点击如下页面进入对应的组件配置页面,如:
- Altermanager:进入的是告警信息查看页
- Grafana:查看监控数据图标
- Prometheus Graph:Prometheus 表达式执行页
- Prometheus Rules:查看 Prometheus 配置的告警表达式页
- Prometheus Targets:监控采集数据采集

在集群概览页可以看见对应的指标监控项:
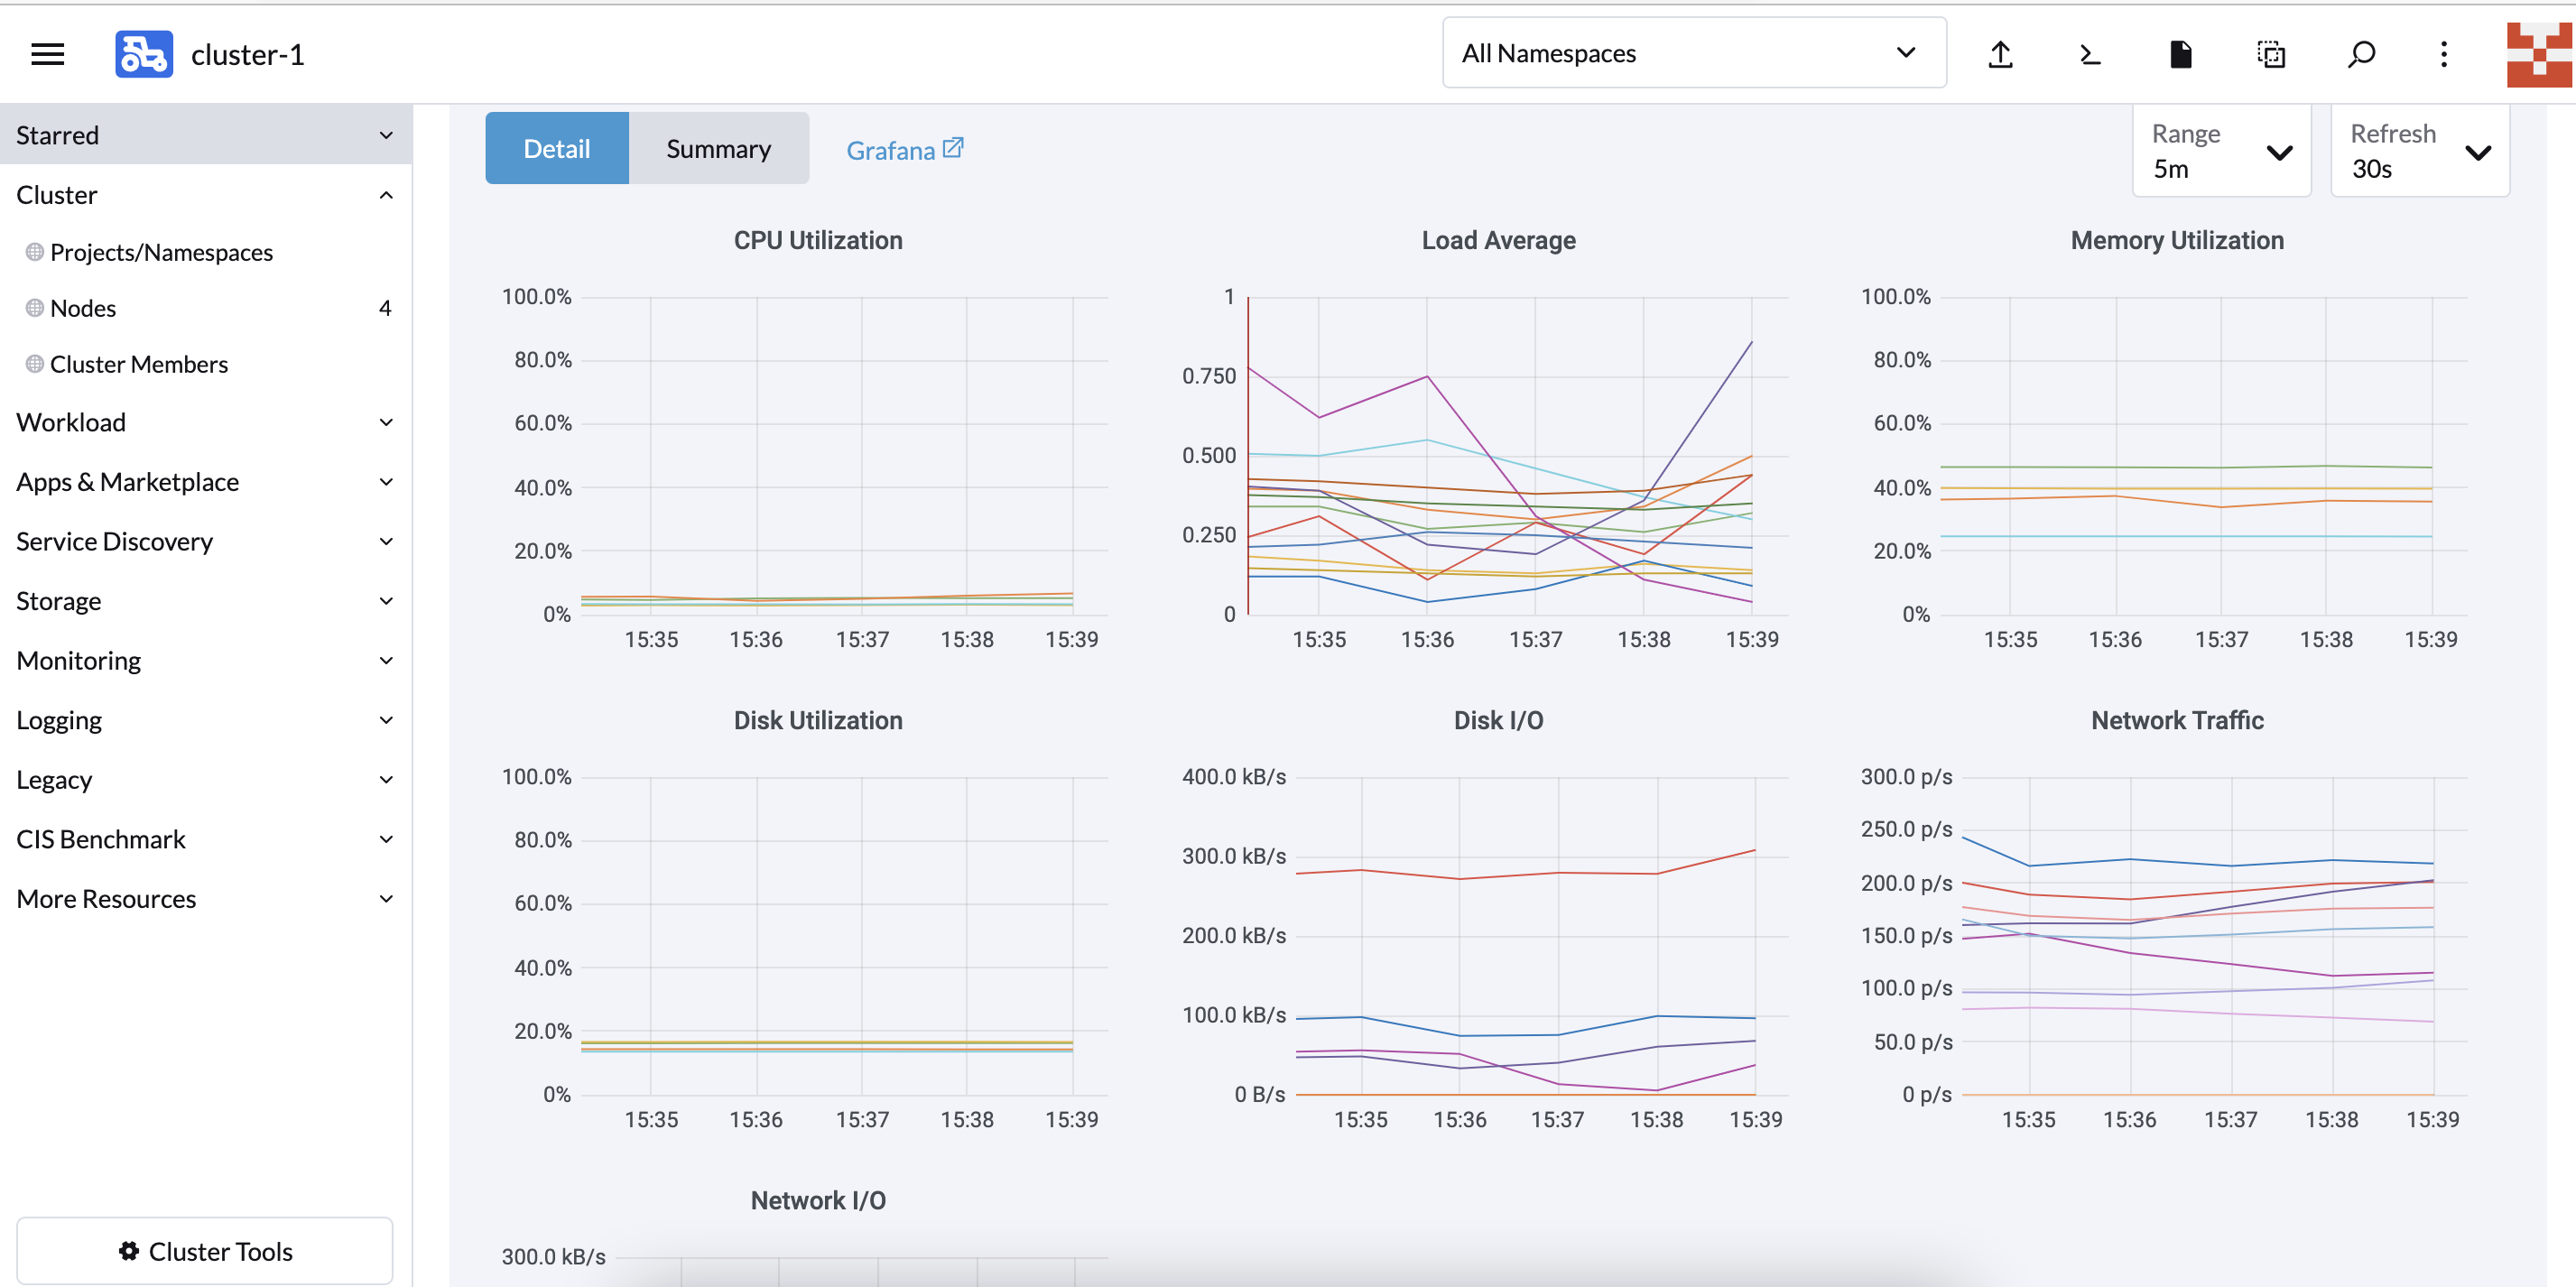
集群层面:
- cpu 使用情况
- 集群节点负载情况
- 内存使用情况
- 磁盘使用率
- 磁盘 IO
- Network Traffic
- Network IO
Kubernetes 组件:
- ApiServer 请求速率
- Controller-Manager 队列深度
- POD scheduler 调度状态
- Ingress-Controller 连接数
ETCD 监控:
- Leader 选举状态
- Leader 选举次数
- GRPC Client Traffic
- ETCD 数据使用容量
- Active Streams
- RPC 速率
- 磁盘数据同步时间
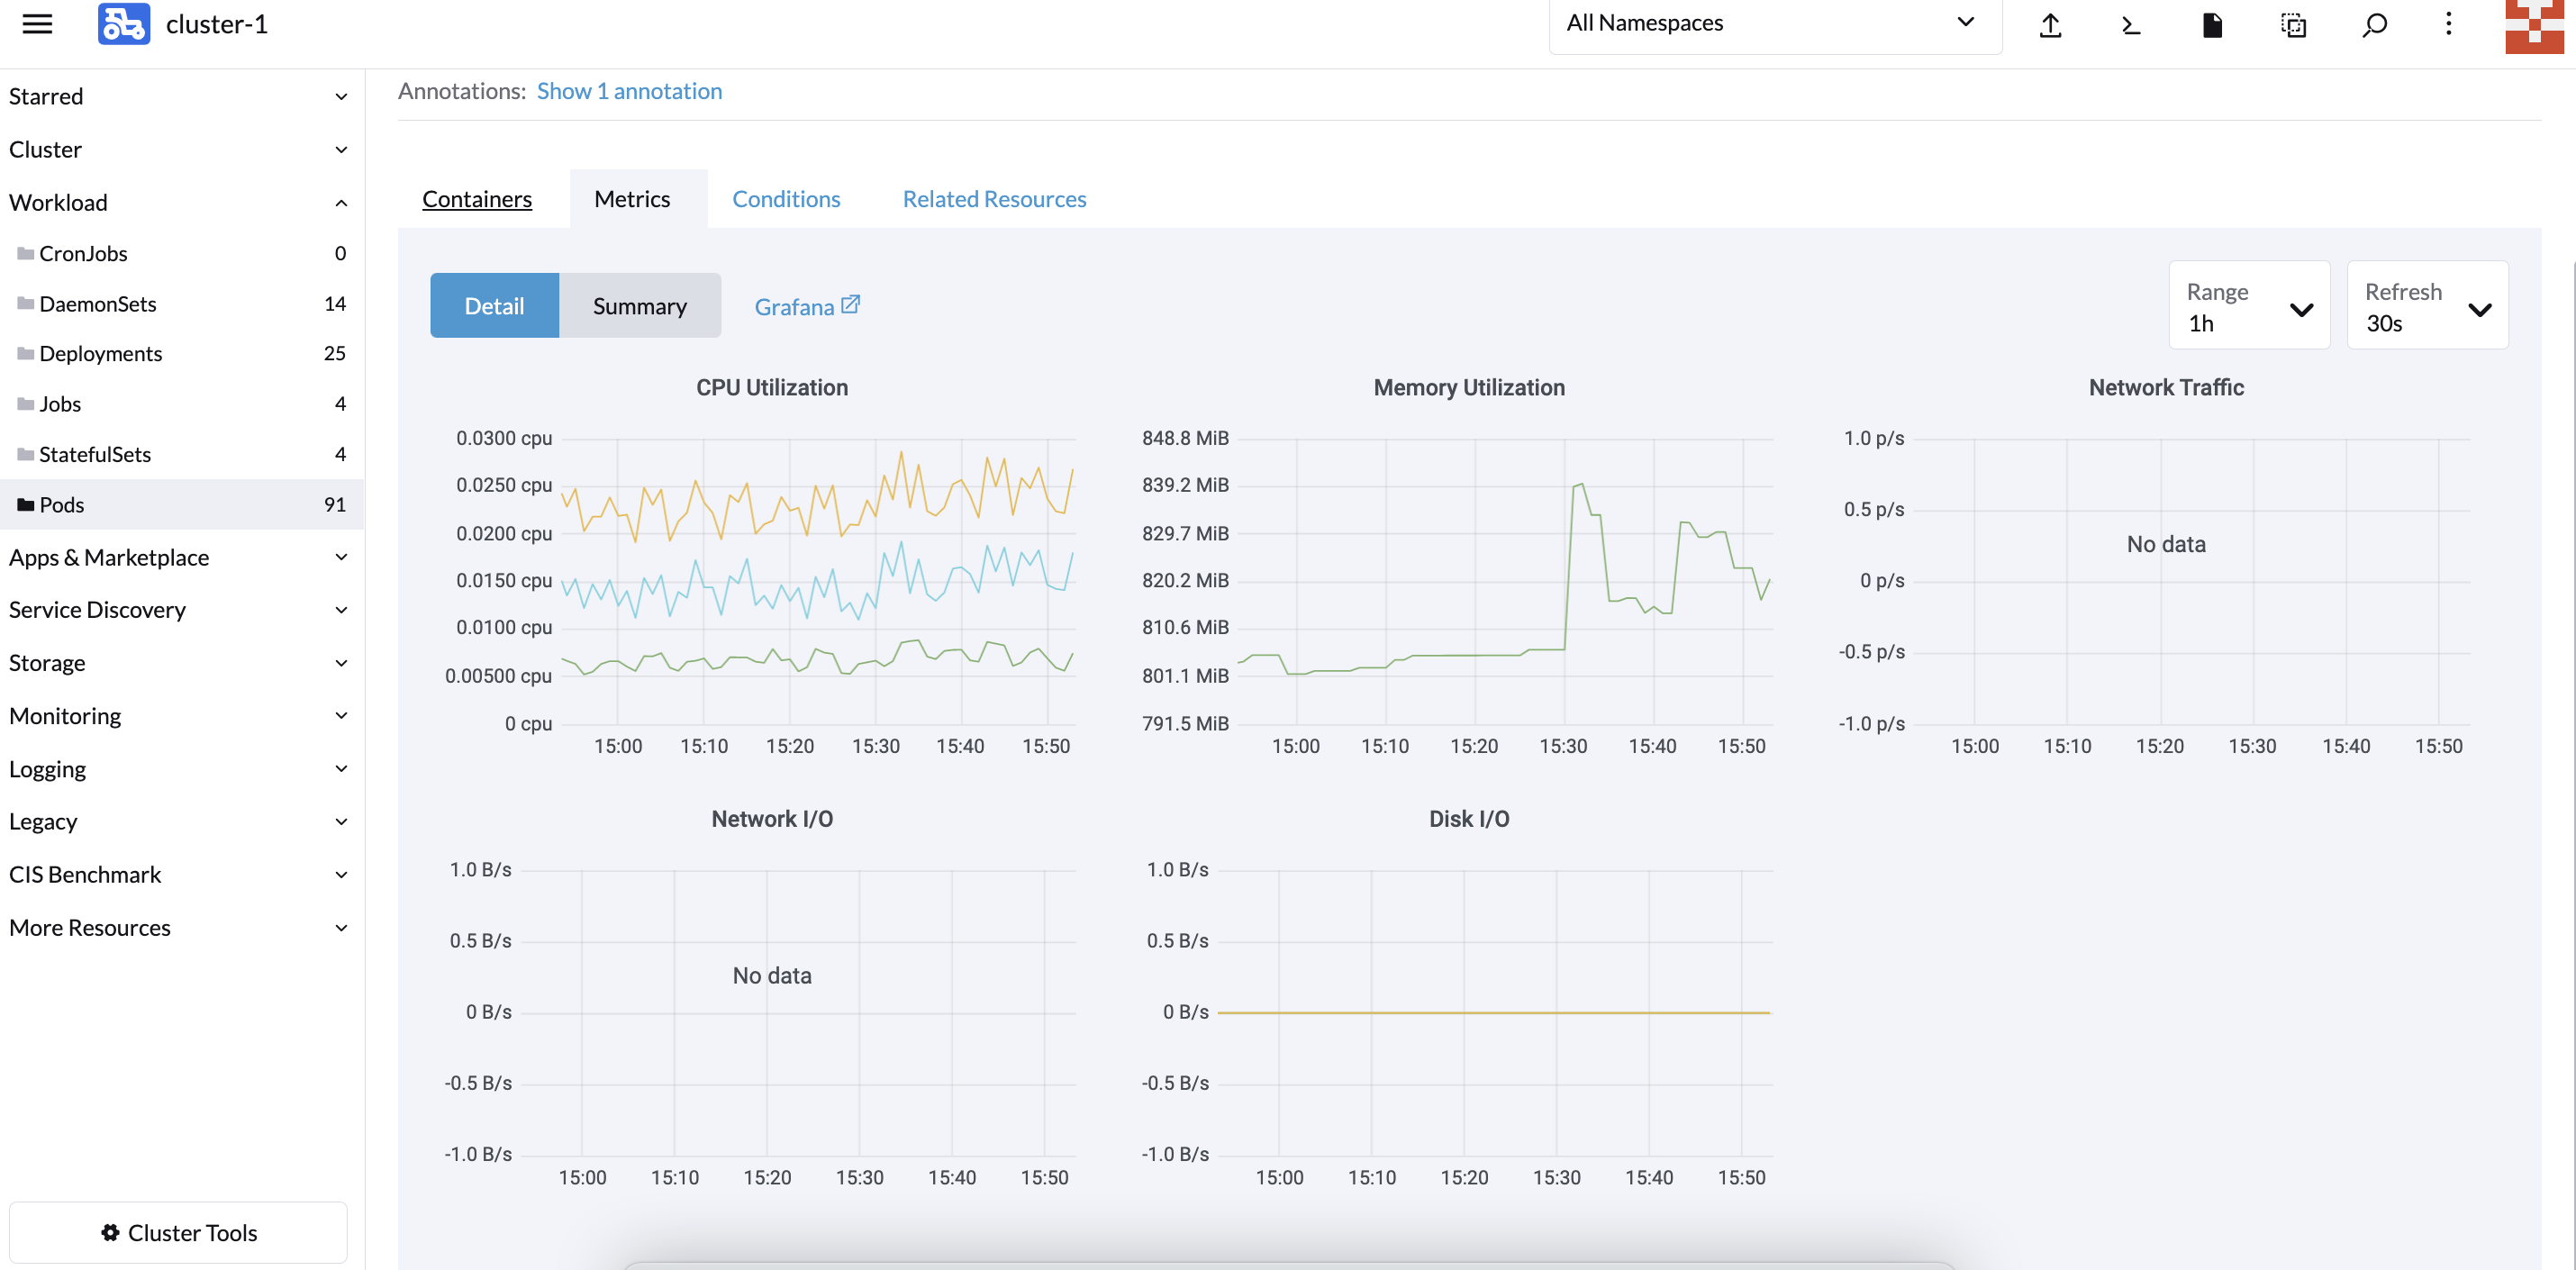
同时在每个部署的 POD 也都包含对应的监控项:
配置自定义监控指标
默认启用监控会会自动添加一些 ServiceMonitor 监控规则和 Prometheus Rules 告警规则,主要是针对平台组件监控和集群内节点状态监控和告警。
如果这些监控指标不满足你的需求,你可以手动添加。比如针对 java 应用的 jmx 监控,Jmx 有官方的 prometheus-export,我们只需要将其 jar 包下载让 java 应用程序加载 jar 包和加载其配置即可。
以一个应用为例,整体流程如下:
- 利用 JMX exporter,在 Java 进程内启动一个小型的 Http server
- 配置 Prometheus 抓取那个 Http server 提供的 metrics
- 配置 Grafana 连接 Prometheus,配置 Dashboard
首先,需要创建文件夹:
mkdir -p /Dockerfile/jmx-exporter/然后,下载 jmx-export.jar 包放到这个目录:
https://github.com/prometheus/jmx_exporterhttps://repo1.maven.org/maven2/io/prometheus/jmx/jmx_prometheus_javaagent/0.12.0/jmx_prometheus_javaagent-0.12.0.jar随后,编写 jvm-export 配置文件放置/root/jmx-exporter/目录,创建 simple-config.yml 内容如下:
---rules:- pattern: ".*"这里意思表示将全部监控信息抓取出来。将 jvm-export 集成到 tomcat 中,重新编写 Dockerfile:
FROM tomcatCOPY ./jmx_prometheus_javaagent-0.12.0.jar /jmx_prometheus_javaagent-0.12.0.jarENV CATALINA_OPTS="-Xms64m -Xmx128m -javaagent:/jmx-exporter/jmx_prometheus_javaagent-0.12.0.jar=6060:/jmx-exporter/simple-config.yml"重新 docker build,build 后执行以下 docker run 命令可以查看收集的监控指标,这里 6060 端口就是我们的 jmx-export 端口:
docker build -t tomcat:v1.0 .docker run -itd -p 8080:8080 -p 6060:6060 tomcat:v1.0访问查看:http://host_ip:6060

部署到 Rancher 平台:

给 Service 打上 label,用于 ServiceMonitor 关联:
kubectl label svc tomcat app=tomcat创建 ServiceMonitor:
apiVersion: monitoring.coreos.com/v1kind: ServiceMonitormetadata: name: tomcat-app namespace: defaultspec: endpoints: - port: exporter selector: matchLabels: app: tomcat创建成功后通过 Prometheus 可以查看到对应的 Target:

对应的监控指标也已经抓取:

进入 grafana 页面添加 dashboard,默认账号密码为 admin/prom-operator:
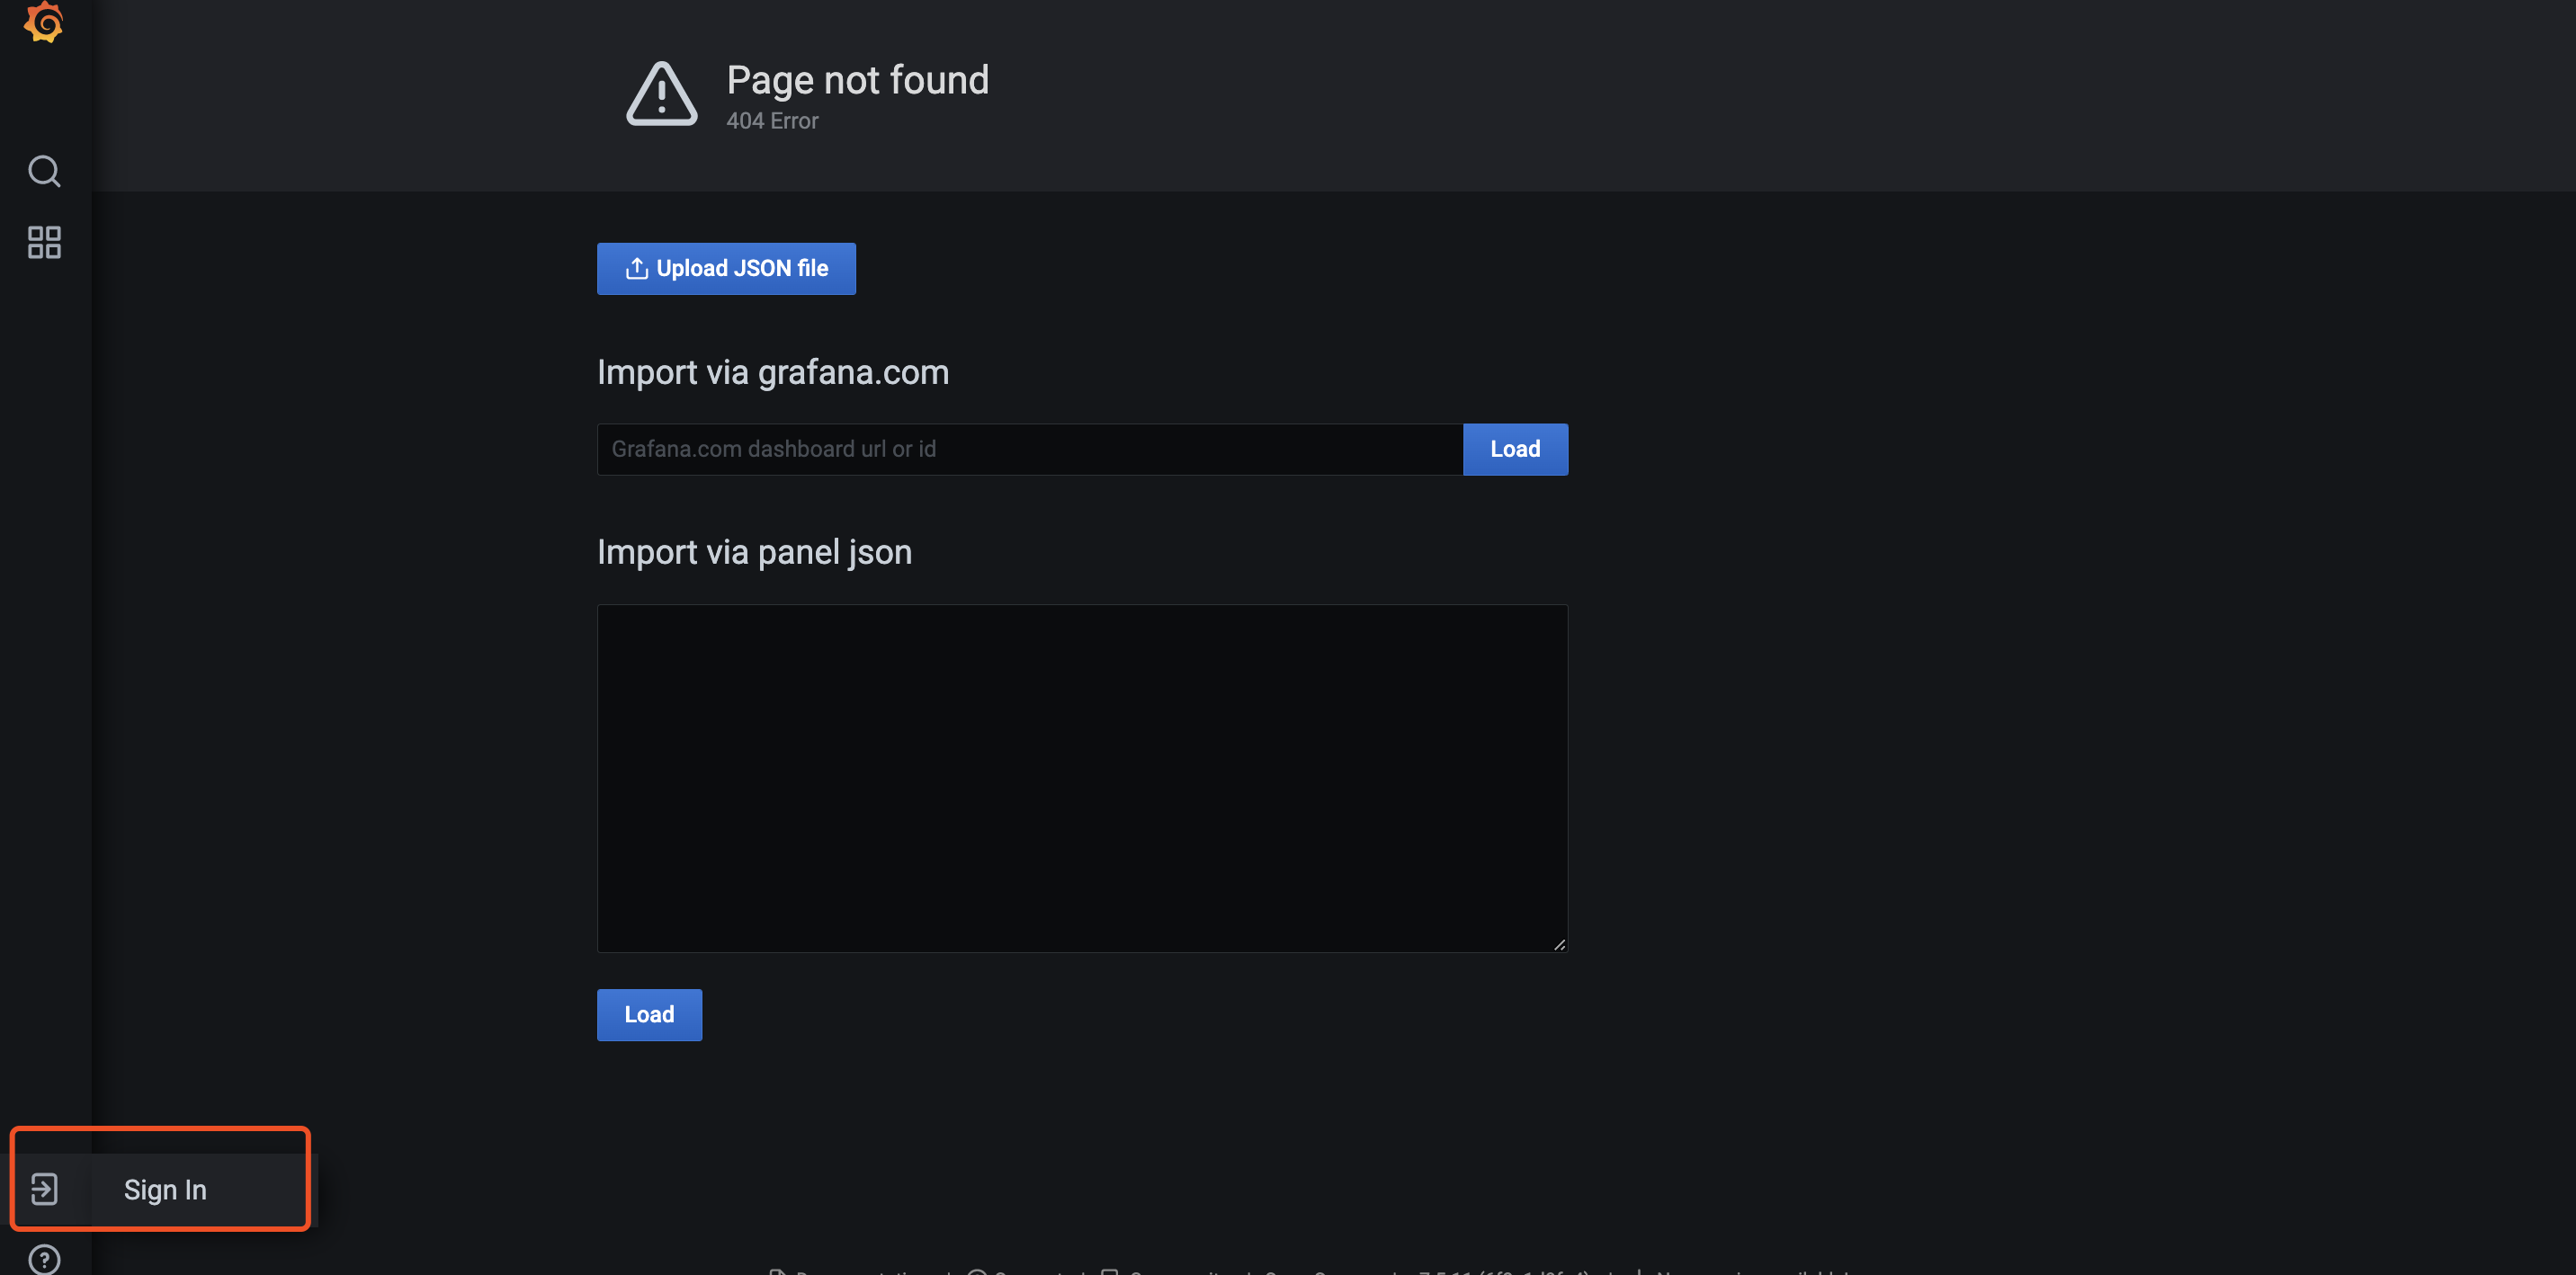
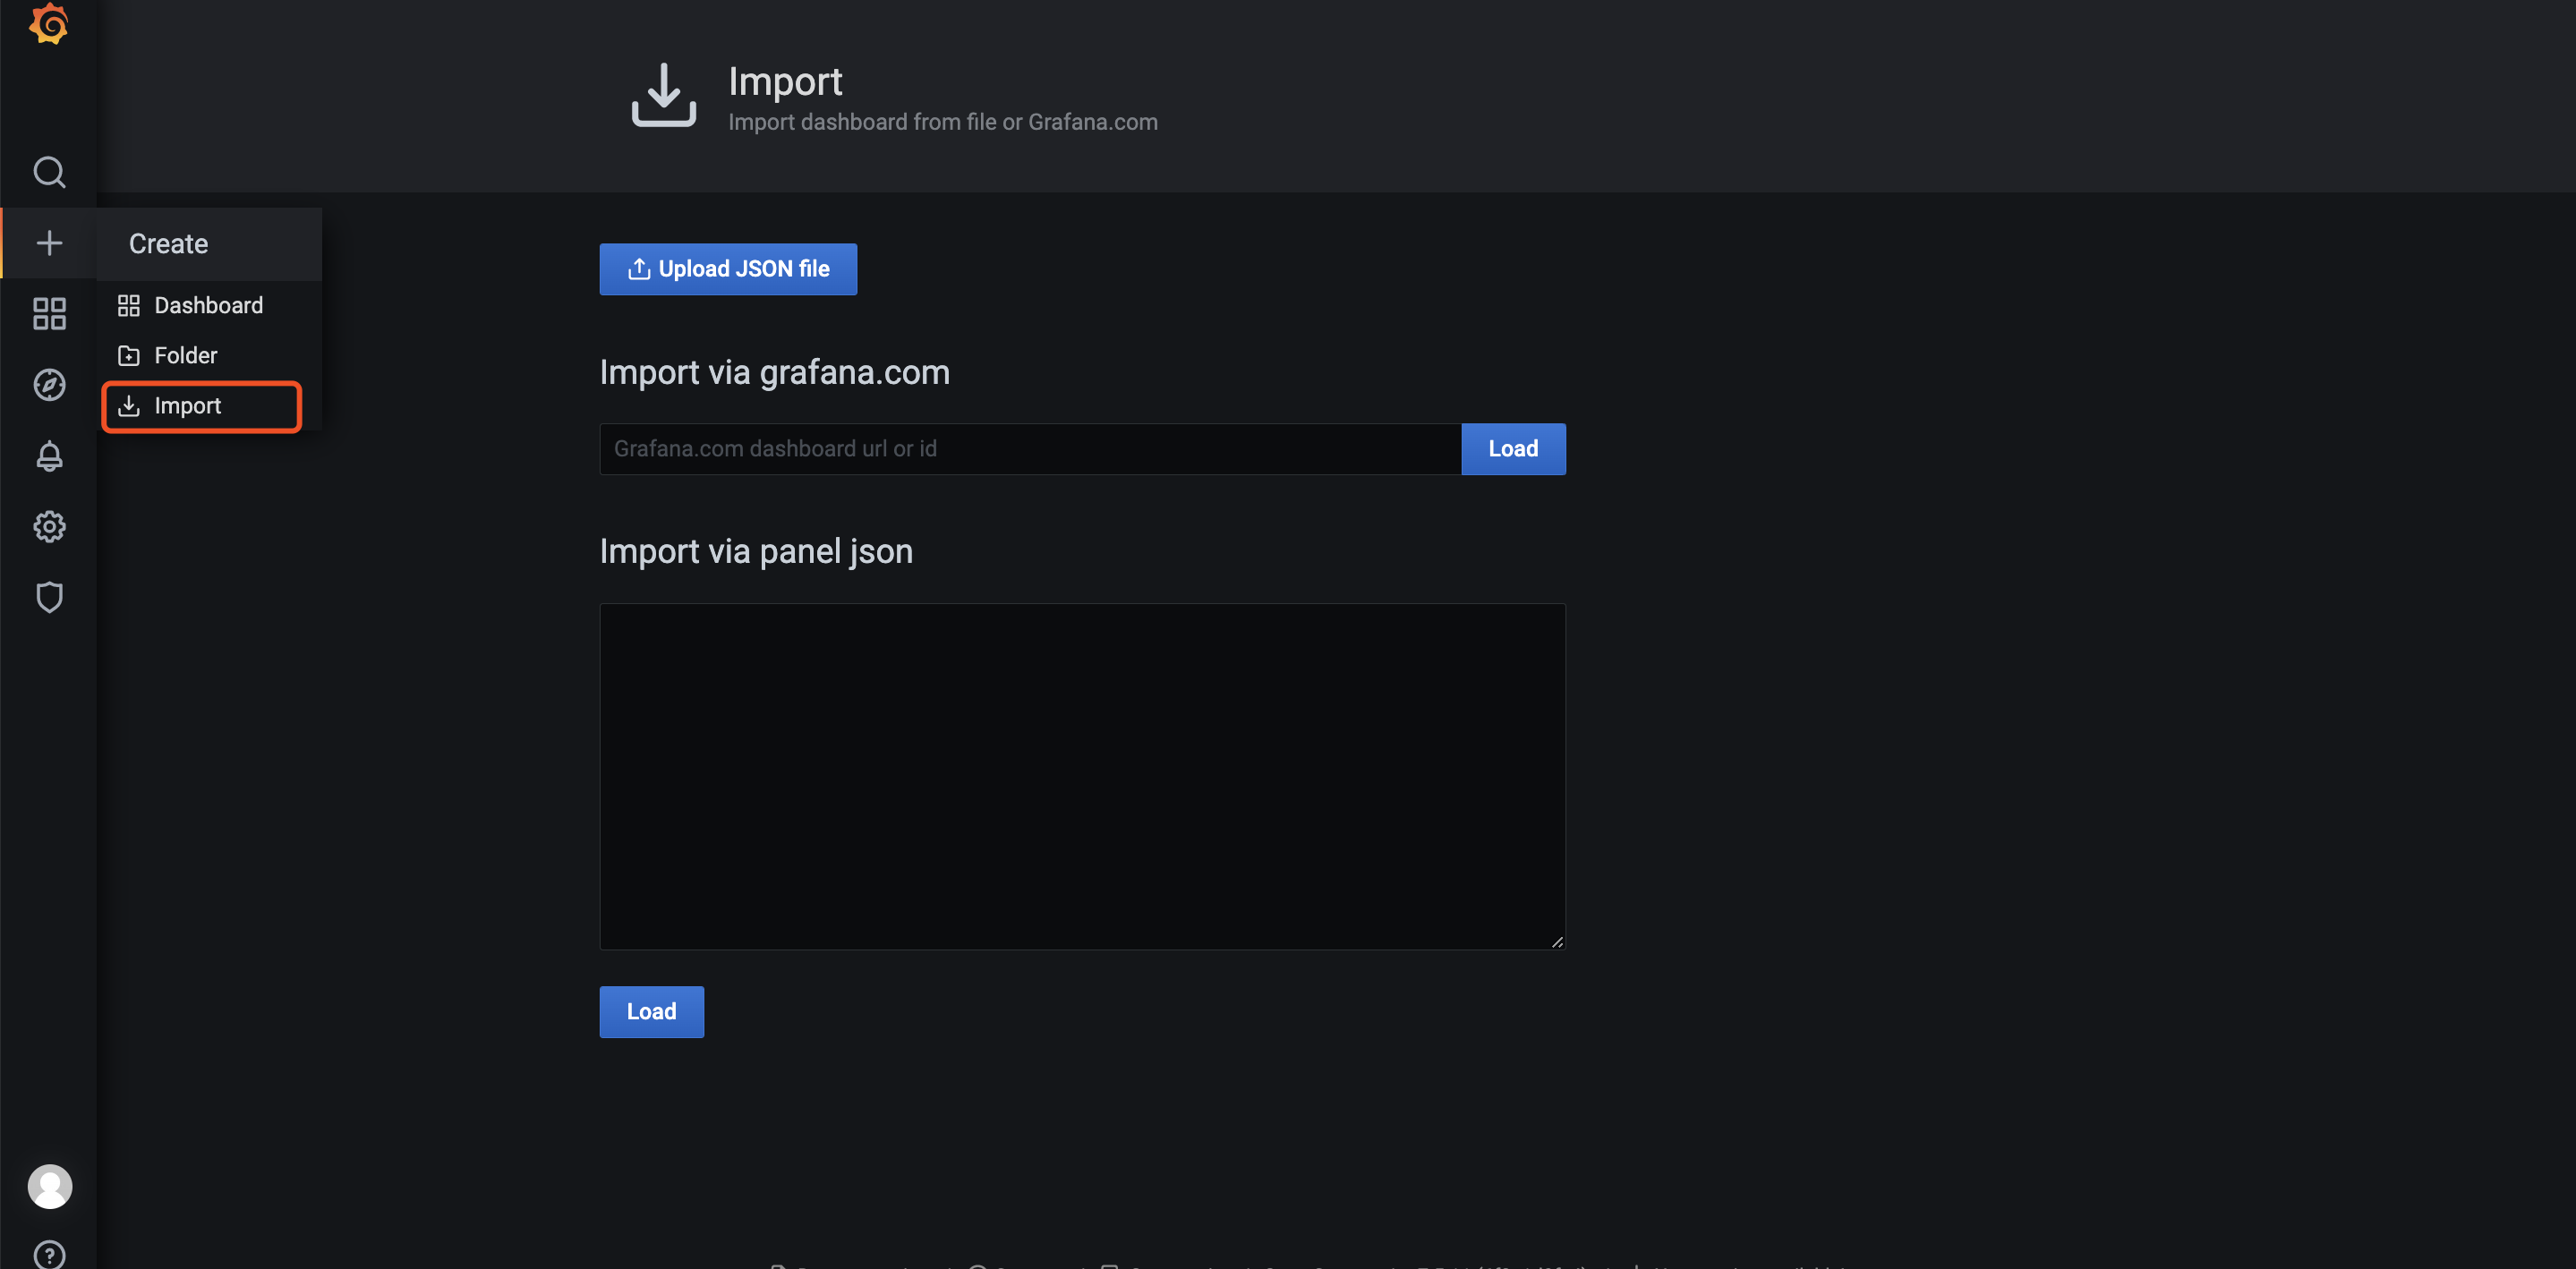
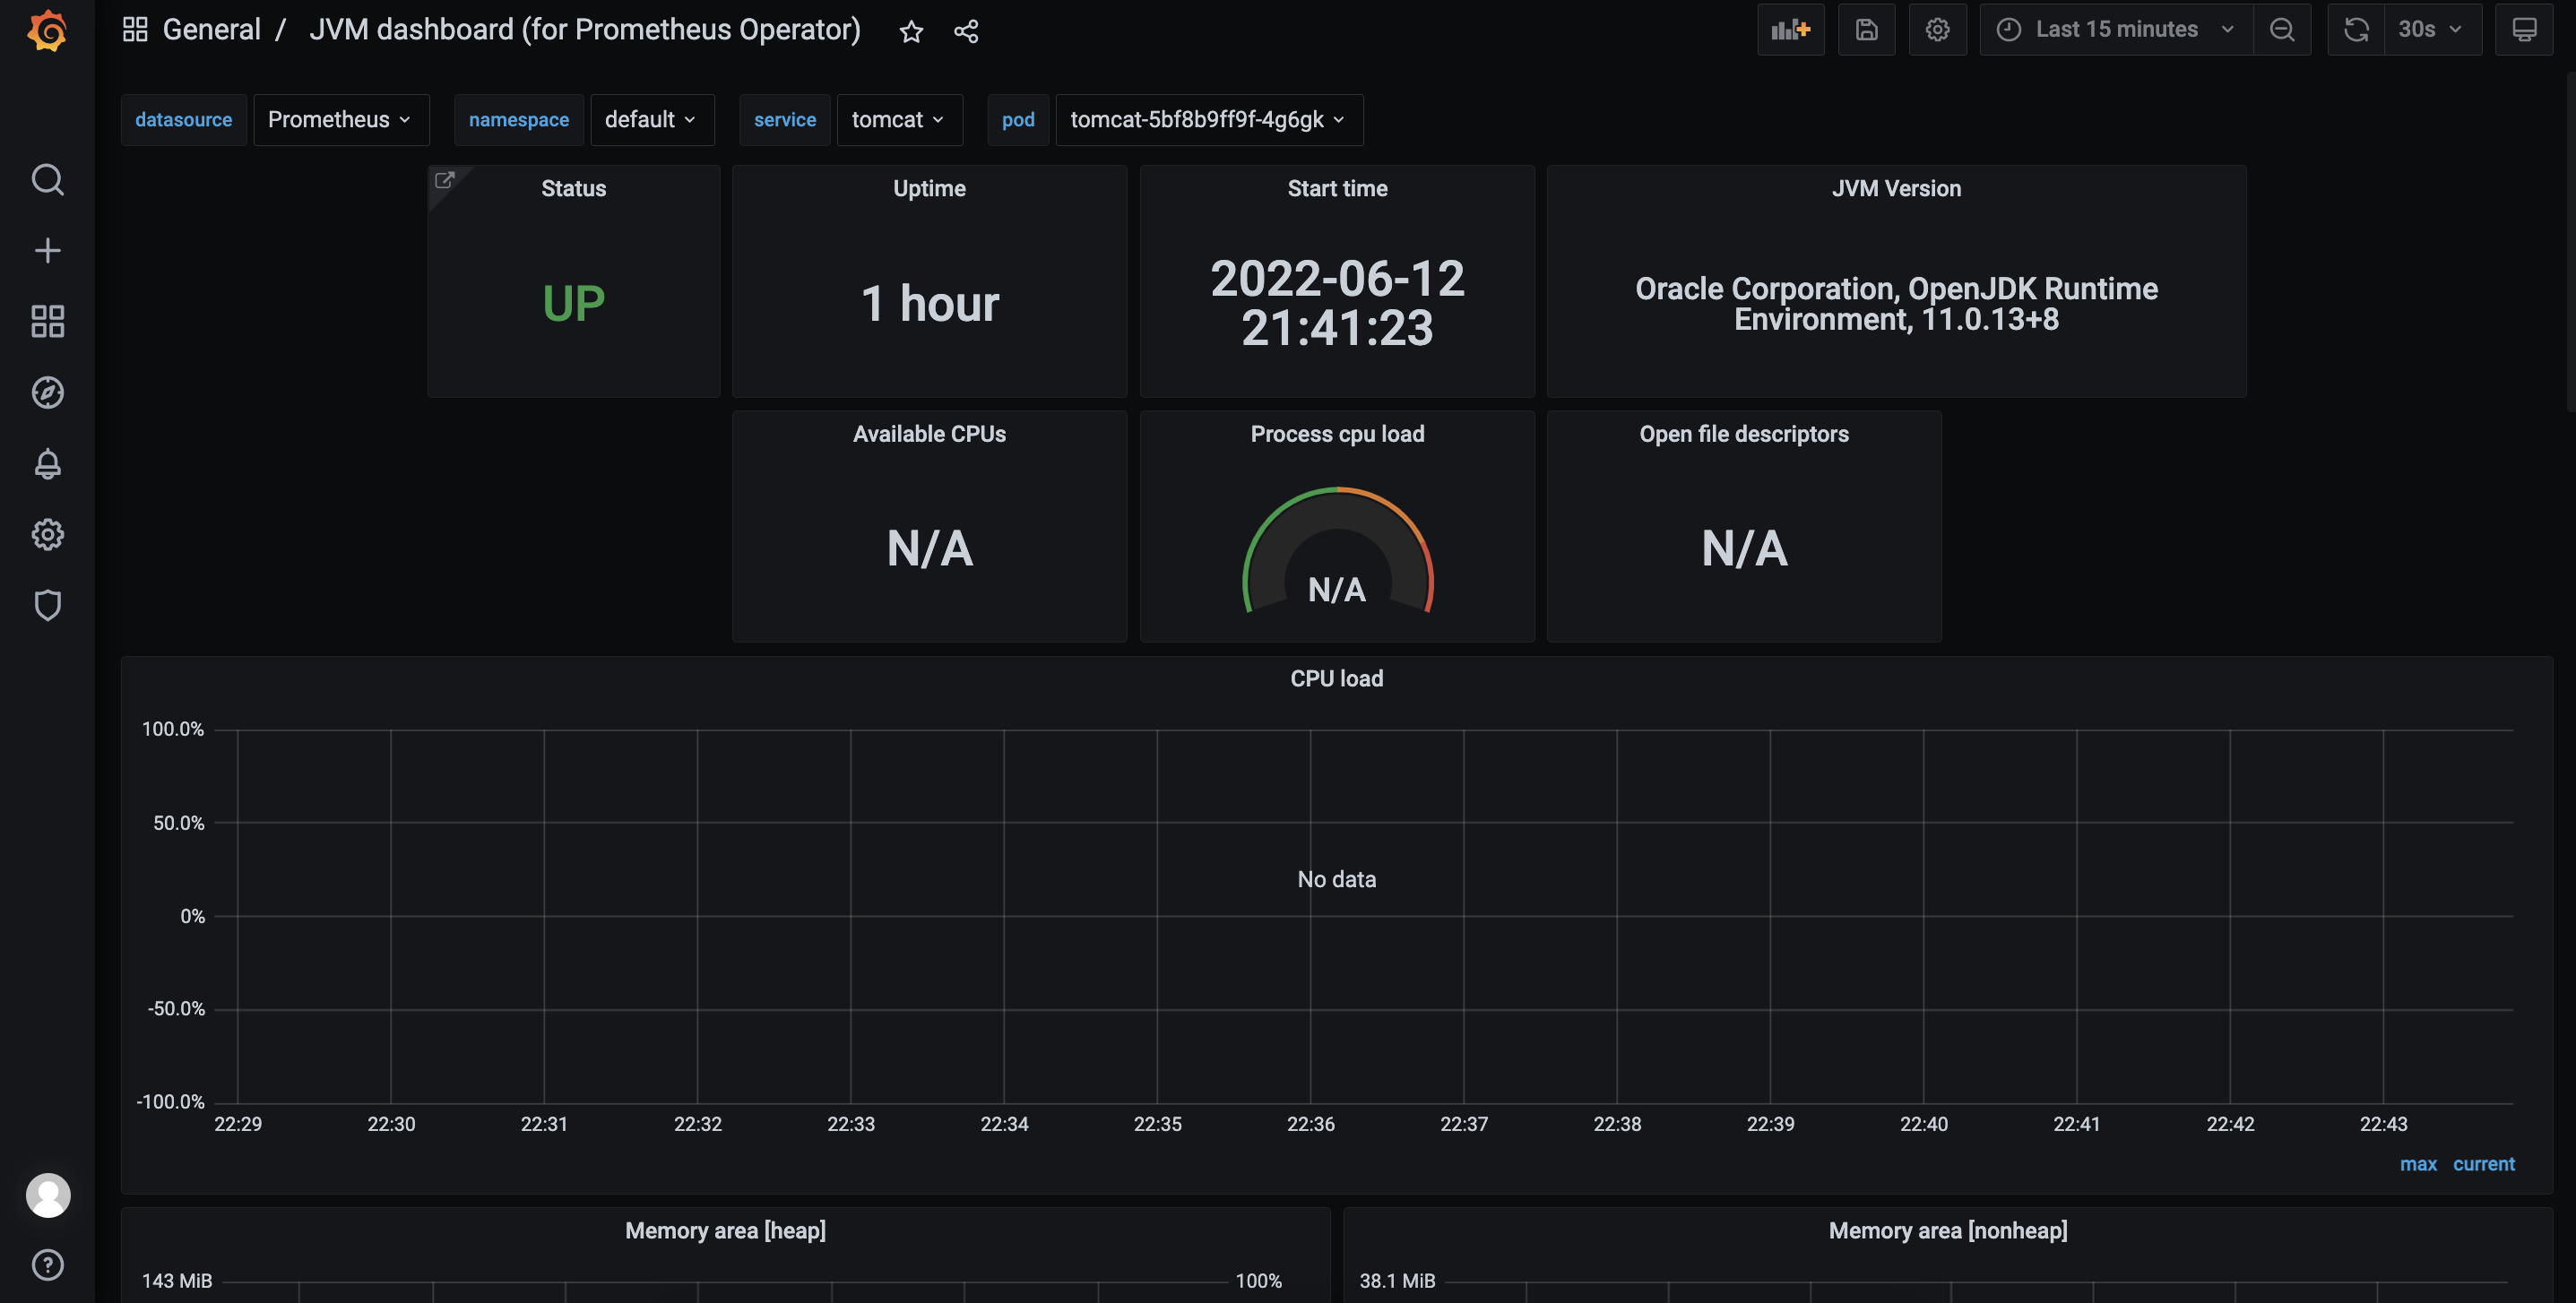
添加 dashboard,输入 dashboard-id,8878,离线环境需要提前将 Dashboard 下载好,通过 json 方式导入:
配置告警
PrometheusRule 用于定义告警规则,默认已经包含针对平台组件和节点的一些告警策略。可以通过配置 Root 和 Receivers 配置告警媒介将对应告警通知到相应的人员。采用 Routing Tree 的告警结构能够快速的将告警进行分类,然后发送到指定的人员进行处理。
Receivers 配置告警媒介,例如填写 SMTP 地址和配置的账号/密码,默认接收的邮箱:

Routes 配置用于告警媒介和告警规则进行匹配,默认创建的 root 规则,用于匹配全部的告警规则,配置上对应创建的告警媒介:

此时全部的告警规则都会发送给配置的告警媒介,若要细分告警规则创建新的 Routes 通过 Label 与 Prometheus Rules 内对应的 Alter name 对接。
如匹配 alert:etcdNoLeader 这条告警规则:


也可以使用正则表达式匹配多个规则如:

Grouping 配置主要用于告警规则分类、抑制避免大量无用告警的干扰:
- group_by:用于配置告警分组,达到告警抑制效果,同一个 group 的告警只会聚合到一起发送一次。例如 host01 上运行了数据库,那么对应的告警包含了 host down、mysql down。他们配置在一个 group 内,那么如果 host down 了对应的 mysql 肯定也是 down 了,那么因为他们配置在一个 group 中,所以 host down 和 mysql down 的告警会聚合到一起发送出去。
- group_wait:新建的 AlterGroup 等待多久后触发第一次告警。
- group_interval:AlterGroup 内产生的不同告警触发间隔时间。
- repeat_interval:AlterGroup 内如果一直是同样的告警,Altermanager 为了避免长时间的干扰,进行告警去重的等待时间。
匹配后,告警触发,可以收到对应的告警邮件:

自定义告警
当默认的告警规则不能满足需求时,可以根据实际情况添加自定义告警,实际就是添加对应的 PrometheusRule。如以下例子,添加 pod 非 running 状态的告警。
UI 配置:

对应 yaml 配置:
apiVersion: monitoring.coreos.com/v1kind: PrometheusRulemetadata: name: podmonitor namespace: cattle-monitoring-systemspec: groups: - name: pod_node_ready rules: - alert: pod_not_ready annotations: message: '{ { $labels.namespace }}/{ { $labels.pod }} is not ready.' expr: 'sum by (namespace, pod) (kube_pod_status_phase{phase!~"Running|Succeeded"}) > 0 ' for: 180s labels: severity: 严重- for:表示持续时间
- message:表示告警通知内的信息
- label.severity:表示告警级别
- expr:指标获取表达式
配置告警接收者:

根据标签匹配到这个 PrometheusRule:


参考链接:
https://mp.weixin.qq.com/s/fT-AXnPP8rrWxTposbi-9A
https://github.com/prometheus-operator/prometheus-operator
https://rancher.com/docs/rancher/v2.6/en/monitoring-alerting/guides/enable-monitoring/
边栏推荐
- How to make a badge
- . Net cloud native architect training camp (responsibility chain mode) -- learning notes
- Theory of technology that must be learned by chip manufacturers (4-1) clock technology and reset Technology
- console. Log() is an asynchronous operation???
- 视频异常检测数据集 (ShanghaiTech)
- How to design a seckill system - geek course notes
- How to quickly obtain and analyze the housing price in your city?
- Android kotlin exception handling
- Reading papers (51):integration of a holonic organizational control architecture and multiobjective
- Script to view the execution of SQLSERVER database stored procedures
猜你喜欢

Self training multi sequence learning with transformer for weakly supervised video animation

暂停更新公告—行走的皮卡丘

torch学习(一):环境配置

信用卡产品开发周期从23周缩短至9周,银行运维组织如何转向敏捷?

org. apache. ibatis. binding. BindingException: Invalid bound statement (not found):...

【Unity】插件TextAnimator 新手使用说明

【win10 VS2019 opencv4.6 配置参考】

【Wwise】Wwise嵌入Unity后打包出现没有声音问题

Customer service system building tutorial_ Installation and use mode under the pagoda panel_ Docking with official account_ Support app/h5 multi tenant operation

全局组织结构控制之抢滩登陆
随机推荐
Analysis of object class structure in Nanny level teaching (common class) [source code attached]
Alien world, real presentation, how does the alien version of Pokemon go achieve?
Theory of technology that must be learned by chip manufacturers (4-1) clock technology and reset Technology
org.apache.ibatis.binding.BindingException: Invalid bound statement (not found):...
[WebSocket] 开发在线客服系统知识点-websocket返回状态码的含义
[Hyperf]Entry “xxxInterface“ cannot be resolved: the class is not instantiable
全局组织结构控制之抢滩登陆
实现领域驱动设计 - 使用ABP框架 - 通用准则
JS custom error
CRMEB 二开短信功能教程
12. Manage network environment
Listen attentively and give back sincerely! Pay tribute to the best product people!
Nanny level teaching! Take you to play with time complexity and space complexity!
Baidu AI Cloud product upgrade Observatory in May
【C工具】------点阵模拟测试2
Similarities and differences between Chinese and American electronic signature SaaS
How to make a badge
论文阅读 (50):A Novel Matrix Game with Payoffs of Maxitive Belief Structure
How to make towel washing label
2021 excellent TDP members' output data summary is coming, come and watch!!!