当前位置:网站首页>Capture packets (Wireshark)
Capture packets (Wireshark)
2022-06-26 03:58:00 【Melting pole】
1 Specify network interface
1.1 Interface type
Wireshark Provides 3 Interface type in , They are local interfaces 、 Pipeline interface and remote interface .
Local interface
The local interface is the inherent interface of the local network host , Such as Ethernet interface 、 Local loopback interface, etc . Using a local interface can only capture packets that pass through the local network interface . stay Wireshark From the menu bar of the “ Capture ”|“ Options ” command , open “ Capture options ” Dialog box , As shown in the figure below .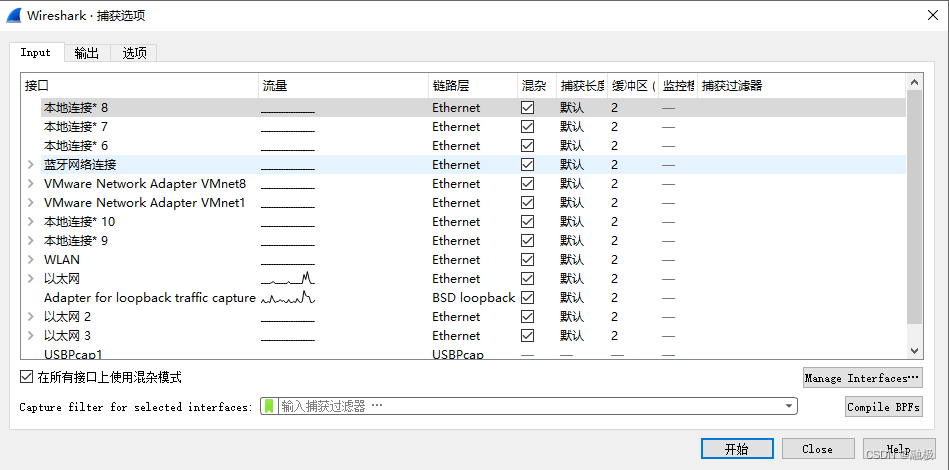
stay “ Capture options ” Dialog box, click “Manage Interfaces” Button , open “ Management interface ” Dialog box , As shown in the figure below .
“ Management interface ” The dialog box includes 3 Tabs , Namely “ Local interface ”、“ The Conduit ”、“ Remote interface ” tab . among ,“ Local interface ” The tab displays all the local interfaces scanned ;“ The Conduit ” The tab shows the pipe interface ;“ Remote interface ” The tab shows the remote interface . From this dialog box, you can see all the local interfaces , All will be displayed by default . If the user does not want to display an interface , take “ Show ” You can cancel the check in the column check box .
Pipe interface
Pipeline interface is through the use of pipelines , Send the data output by a tool to Wireshark, And then capture the corresponding packets . for example , If the user's location cannot be used Wireshark Capture packets , You can use other command lines ( Such as tcpdump and dumpcap etc. ) Tools to capture packets . Then use the pipe interface mode , Send the captured data to Wireshark.
Remote interface
Remote interface refers to the remote client passing data to the local interface through the network . Users only need to install the corresponding on the remote host rpcapd service , You can execute on the local computer Wireshark, Capture traffic from remote computers .
1.2 Select interface
When the user knows the interface type clearly , You can select the corresponding interface to capture data packets .
among , The line format corresponding to the network interface is wave , It means that there is data transmission ; If it's a straight line , It means that there is no data transmission . here , The user selects an interface , And click the start capture grouping button in the toolbar , Will start capturing data .
【 example 】 Capture both Ethernet and VMware Network Adapter VMnet8 The data package of the interface .
stay Wireshark Start interface or “ Capture ”|“ Options ” Interface press and hold Ctrl key , Select Ethernet and VMware Network Adapter VMnet8 Interface interface , As shown in the figure below .
Capture connection dialog
Users can also “ Capture interface ” Select the interface in the dialog box . In the menu bar , Choose in turn “ Capture ”|“ Options ” command , open “ Capture interface ” Dialog box .
stay “ Capture interface ” In the dialog box ,“ Input ” Tabs are provided to include 8 Column , They are interfaces 、 Traffic 、 Link layer head 、 Hybrid 、 Capture length 、 cache 、 Monitor mode and capture filter . from “ Interface ” Column to see all the local interfaces scanned . The user clicks the triangle to the left of the interface name , You can see the address of the interface , As shown in the figure above .
From the above figure, you can see the Ethernet interface IPv6 Address and IPv4 Address . in addition , Users can also enable promiscuous mode , Indicates that packets from other hosts other than the current host are captured . If you want to enable the hybrid mode of an interface , Then check “ Hybrid ” Column check box . If all interfaces are enabled in promiscuous mode , Then check “ Use hybrid mode on all interfaces ”. Select the captured interface in the interface list , And click “ Start ” Button , You can start capturing packets . If the user wants to capture packets from multiple interfaces , According to the same Ctrl Key to select multiple interfaces .
2 Use pipe interface
边栏推荐
- 169. most elements
- 线程同步之条件变量
- 1. foundation closing
- Webrtc series - 6-connections tailoring for network transmission
- R语言与机器学习
- 2022.6.24-----leetcode. five hundred and fifteen
- Flask入门
- (15) Blender source code analysis flash window display menu function
- 商城风格也可以很多变,DIY 了解一下
- 如何解决 Iterative 半监督训练 在 ASR 训练中难以落地的问题丨RTC Dev Meetup
猜你喜欢


随机推荐
Uni app custom selection date 1 (September 16, 2021)
[Flink] a brief analysis of the writing process of Flink sort shuffle
(15) Blender source code analysis flash window display menu function
The stc-isp burning program for 51 single chip microcomputer always shows that "the target single chip microcomputer is being detected..." the cold start board does not respond
I/O 虚拟化技术 — VFIO
What preparations should be made to develop an app from scratch
When the tiflash function is pushed down, it must be known that it will become a tiflash contributor in ten minutes
In the matter of getting customers at sea, how can advertisers play besides digital advertising?
matplotlib折线图,文字显示,win10
Getting started with flask
VHDL设计
Unity移动端游戏性能优化简谱之 以引擎模块为划分的CPU耗时调优
DETR3D 多2d图片3D检测框架
ABP framework Practice Series (III) - domain layer in depth
2020 summary: industrial software development under Internet thinking
Contains an object field at offset position
After a test of 25K bytes, I really saw the basic ceiling
阿里云函数计算服务一键搭建Z-Blog个人博客
What should I do if the 51 SCM board cannot find the device in keil
[Flink] Flink source code analysis - creation of jobgraph in batch mode