当前位置:网站首页>Paper:Generating Hierarchical Explanations on Text Classification via Feature Interaction Detection
Paper:Generating Hierarchical Explanations on Text Classification via Feature Interaction Detection
2022-06-25 08:24:00 【Happy little yard farmer】
The paper :Generating Hierarchical Explanations on Text Classification via Feature Interaction Detection
github:https://github.com/UVa-NLP/HEDGE
1. Introduction
- Generating explanations for neural networks, help understand the decision-making of black-box models
- Existing local explanation methods: provide important features which are words or phrases–ignore interactions between words and phrases
- This work: HEDGE, build hierarchical explanations by detecting feature interactions

2. Contributions
- design a top-down model-agnostic method of constructing hierarchical explanations via feature interaction detection;
- propose a simple and effective scoring function to quantify feature contributions with respect to model predictions;
- compare the proposed algorithm with several competitive methods on explanation generation via both automatic and human evaluations.
3. Method
3.1 Building hierarchical explanations
Text classification task: let x = ( x 1 , … , x n ) x = (x_1,\dots, x_n) x=(x1,…,xn) denote a text with n n n words and y ^ \hat{y} y^ be the prediction label from a well-trained model.
A partition of the word sequence with KaTeX parse error: Undefined control sequence: \cal at position 1: \̲c̲a̲l̲ ̲P text spans
KaTeX parse error: Undefined control sequence: \cal at position 2: \̲c̲a̲l̲ ̲P=\{x_{(0,s_1]}…HEDGE: divide text span x ( s i , s i + 1 ] x_{(s_i,s_{i+1}]} x(si,si+1] into two smaller spans: x ( s i , j ] x_{(s_i,j]} x(si,j] and x ( j , s i + 1 ] x_{(j,s_{i+1}]} x(j,si+1] , j j j is the dividing point ( s i < j < s i + 1 ) (s_i<j<s_{i+1}) (si<j<si+1)

Two crucial questions need to be addressed:
- which text span the algorithm should pick to split?
- where is the dividing point?
min x ( s i , s i + 1 ] ∈ P min j ∈ ( s i , s i + 1 ) ϕ ( x ( s i , j ] , x ( j , s i + 1 ] ∣ P ) \min_{x_{(s_i,s_{i+1}]}\in P}\min_{j\in (s_i,s_{i+1})} \phi(x_{(s_i,j]},x_{(j,s_{i+1}]}\vert P) x(si,si+1]∈Pminj∈(si,si+1)minϕ(x(si,j],x(j,si+1]∣P)
ϕ ( x ( s i , j ] , x ( j , s i + 1 ] ∣ P ) \phi(x_{(s_i,j]},x_{(j,s_{i+1}]}\vert P) ϕ(x(si,j],x(j,si+1]∣P): interaction score
ψ ( ⋅ ) \psi(\cdot) ψ(⋅): the feature importance function. Evaluate the contributions of new spans and update the contribution set C C C.
3.2 Detecting feature interaction
Consider the effects of other text spans when calculate the interaction between (the interaction between two
words/phrases is closely dependent on the context )
Reduce computational complexity into polynomial: only consider m neighbor text spans

3.3 Quantifying feature importance
Measure the contribution of a feature x ( s i , s i + 1 ] x_{(s_i,s_{i+1}]} x(si,si+1] to the model prediction, define the importance score as

This importance score measures how far the prediction on a given feature is to the prediction boundary, hence the confidence of classifying x ( s i , s i + 1 ] x_{(s_i,s_{i+1}]} x(si,si+1] into the predicted label y ^ \hat{y} y^.
4. Experiments
4.1 Setup
- Task: text classification
- Model: LSTM, CNN, BERT
- Benchmark: SST, IMDB

4.2 Quantitative Evaluation
The first two metrics measure local fidelity by deleting or masking top-scored words and comparing the probability change on the predicted label.
- AOPC (the area over the perturbation curve): By deleting top k% words, AOPC calculates the average change in the prediction probability on the predicted class over all test data.

Higher AOPCs are better, which means that the deleted words are important for model prediction.
- Log-odds: Log-odds score is calculated by averaging the difference of negative logarithmic probabilities on the predicted class over all of the test data before and after masking the top r% features with zero paddings.

Lower log-odds scores are better.
The cohesion-score measures the synergy of words within a text span to the model prediction by shuffling the words to see the probability change on the predicted label.
Cohesion-score: We propose cohesion-score to justify an important text span identified by HEDGE.
Given an important text span x ( a , b ] x_{(a,b]} x(a,b], randomly pick a position in the word sequence ( x 1 , … , x a , x b + 1 , … , x n ) (x_1,\dots,x_a,x_{b+1},\dots,x_n) (x1,…,xa,xb+1,…,xn) and insert a word back, until construct a shuffled version of the original sentence x ˉ \bar{x} xˉ.
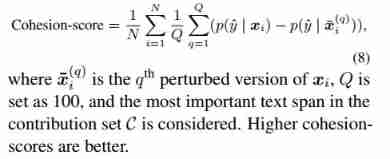
the words in an important text span have strong interactions, after perturbing, the output probability decreasing.
Higher cohesion-scores are better.
Results:


4.3 Qualitative Analysis
- Example 1: compare HEDGE with ACD in interpreting the LSTM model

- Example 2: compare HEDGE in interpreting two different models (LSTM and BERT)

4.4 Human Evaluation
We had 9 human annotators from the Amazon Mechanical Turk (AMT) for human evaluation.
- Compare HEDGE with other baselines using the predictions made by the same LSTM model.
- Compare the explanations generated by HEDGE on three different models: LSTM, CNN,
and BERT.
We measure the number of human annotations that are coherent with the actual model predictions, and define the coherence score as the ratio between the coherent annotations and the total number of examples.

Results:
- HEDGE can capture important features which are highly consistent with human interpretations.
- BERT can achieve higher prediction accuracy than the other two models, its coherence score is lower, manifesting a potential tradeoff between accuracy and interpretability of deep models.
5. Conclusion
HEDGE is capable of explaining model prediction behaviors, which helps humans understand the decision-making
Welcome to my official account. 【SOTA Technology interconnection 】, I will share more dry goods .

边栏推荐
- Niuke: flight route (layered map + shortest path)
- FFT [template]
- 测一测现在的温度
- Not afraid of losing a hundred battles, but afraid of losing heart
- 股票网上开户安全吗?小白求指导
- Electronics: Lesson 012 - Experiment 13: barbecue LED
- Home server portal easy gate
- 自制坡道,可是真的很香
- Is it safe to open an account for stocks on the Internet? Can the securities account be used by others?
- VOCALOID notes
猜你喜欢

How to do factor analysis? Why should data be standardized?
![[QT] QT 5 procedure: print documents](/img/76/2fce505c43f75360a8ff477aa2d31d.png)
[QT] QT 5 procedure: print documents
Bluecmsv1.6-代码审计

物联网毕设(智能灌溉系统 -- Android端)

五分钟快速搭建一个实时人脸口罩检测系统(OpenCV+PaddleHub 含源码)

TCP and UDP

每日刷题记录 (三)

Almost taken away by this wave of handler interview cannons~

Wechat applet opening customer service message function development

Electronics: Lesson 012 - Experiment 13: barbecue LED
随机推荐
The first game of 2021 ICPC online game
Daily question brushing record (III)
Not afraid of losing a hundred battles, but afraid of losing heart
Static web server
How to calculate the independence weight index?
A solution to slow startup of Anaconda navigator
How to analyze the grey prediction model?
[supplementary question] 2021 Niuke summer multi school training camp 1-3
六月集训(第25天) —— 树状数组
Common SRV types
CVPR 2022 Oral 2D图像秒变逼真3D物体
STM32CubeMX 学习(5)输入捕获实验
Is there any risk in making new bonds
是否可以给数据库表授予删除列对象的权限?为什么?
Rqt command
Self made ramp, but it really smells good
Number theory template
4个不可不知的采用“安全左移”的理由
Rank sum ratio (RSR) index calculation
How to calculate the D value and W value of statistics in normality test?