当前位置:网站首页>Mapboxgl + GeoServer configuration local map tutorial
Mapboxgl + GeoServer configuration local map tutorial
2022-07-24 05:33:00 【DoYouKnowArcgis】
Catalog
3、 ... and 、geoserver Installation
Four 、 utilize geoserver Release shapefile data
5、 ... and 、 Check our published data
6、 ... and 、 Deployment of offline map
zero 、 Preparation stage
Environmental requirements :JDK1.8
apache-tomcat-7.0.88
geoserver.war
plug-in unit geoserver-2.13-SNAPSHOT-vectortiles-plugin( Provide slicing function )
One 、JDK Installation
We downloaded JDK![]() , Open for installation , Put all the installation results into a folder created by yourself ( Easy to manage ).
, Open for installation , Put all the installation results into a folder created by yourself ( Easy to manage ).
Next , Yes JDK Configure the relevant environment .
(1) newly build -> Variable name "JAVA_HOME", A variable's value "C:\Java\jdk1.8.0_05"( namely JDK Installation path for )
(2) edit -> Variable name "Path", Add the “;%JAVA_HOME%\bin;%JAVA_HOME%\jre\bin”
(3) newly build -> Variable name “CLASSPATH”, A variable's value “.;%JAVA_HOME%\lib;%JAVA_HOME%\lib\dt.jar;%JAVA_HOME%\lib\tools.jar”
Installation configuration inspection .
Win+R à cmd Access control , Input java javac java -version Three instructions , If the above operations are correct , Then return the correct instruction .


Two 、Tomcat Configuration of
1. Click the new button in the system variable area , Fill in the variable name as CATALINA_HOME, The variable value is customized Tomcat Environment variables for the directory of
2. Click the new button in the system variable area , Fill in the variable name as CATALINA_BASE, The variable value is customized Tomcat Environment variables for the directory of
3. Find the system variables Path, stay Path Newly added “%CATALINA_HOME%\lib;%CATALINA_HOME%\bin” Environment variables of , Be careful “;” A semicolon ;
start-up Tomcat,Tomcat/bin/startup.bat, To be seen xxxms after , Open it in a browser localhost:8080, If the display

3、 ... and 、geoserver Installation
take geoserver.war Put it in webapps in , restart Tomcat,Tomcat It will automatically correct geoserver.war unpack .
Input http://localhost:8080/geoserver/web/ Then enter geoserver Home page .

user name admin password geoserver
After logging in , The main page is as follows , Relevant functions are shown in Figure .
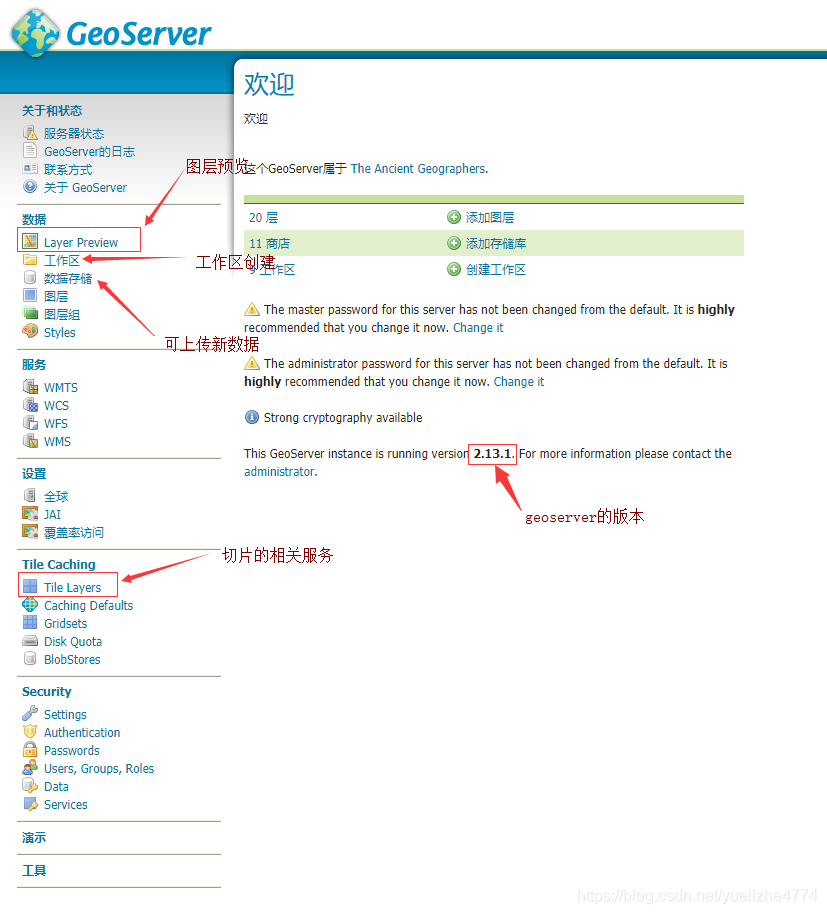
Click on the layer —— Select a layer we want to see , If you want to change the uploaded data into 
There are four formats , The plug-in needs to be geoserver-2.13-SNAPSHOT-vectortiles-plugin Put it in D:\apache-tomcat-7.0.88\webapps\geoserver\WEB-INF\lib in , restart Tomcat that will do .

Four 、 utilize geoserver Release shapefile data
Click on 【 data storage 】--【 Add a new data store 】

New data source — choice shapefile, After clicking


After clicking save , Click publish

Go to the settings page , Border by “ Calculate... From the data ”---“Compute from native bounds”, The next step is to Tile Caching Format the vector slice in .

5、 ... and 、 Check our published data
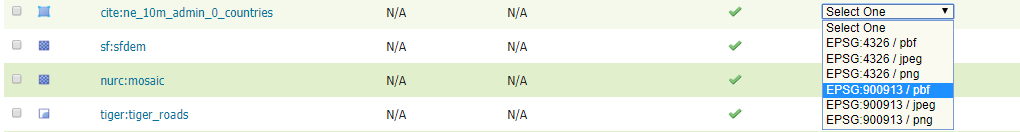
Tile Caching
Select One You can view the data type we choose , meanwhile You can preview .Seed/Truncate Data can be sliced and cached locally .
![]()
Click on Submit You can complete the cache of slices ( According to the data , This determines the cache speed .)

6、 ... and 、 Deployment of offline map
geoserver Three ways to obtain vector slices
1. adopt tms service http://localhost:8080/geoserver/gwc/service/tms/1.0.0/china:[email protected]:[email protected]/{z}/{x}/{y}.pbf Get vector slices ,
2. There are also wmts service http://127.0.0.1:8080/geoserver/gwc/service/wmts?REQUEST=GetTile&SERVICE=WMTS&VERSION=1.0.0&LAYER=china:china_map&STYLE=&TILEMATRIX=EPSG:900913:{z}&TILEMATRIXSET=EPSG:900913&FORMAT=application/x-protobuf;type=mapbox-vector&TILECOL={x}&TILEROW={y} Get vector slices .
3. And by XYZ:http://test.sharegis.cn/mapbox/maptile/{z}/{x}/{y}.pbf Directly access the slice virtual directory to get slices .( Offline tile )

<!DOCTYPE html>
<html>
<head>
<meta charset='utf-8' />
<title> Local map carrying </title>
<meta name='viewport' content='initial-scale=1,maximum-scale=1,user-scalable=no' />
<script src='https://api.tiles.mapbox.com/mapbox-gl-js/v1.0.0/mapbox-gl.js'></script>
<link href='css/VGEs.css' rel='stylesheet' />
<script src='https://api.mapbox.com/mapbox-gl-js/plugins/mapbox-gl-compare/v0.1.0/mapbox-gl-compare.js'></script>
<script type="text/javascript" src="js/jquery.js"></script>
<link rel='stylesheet' href='https://api.mapbox.com/mapbox-gl-js/plugins/mapbox-gl-compare/v0.1.0/mapbox-gl-compare.css' type='text/css' />
<style>
body { margin:0; padding:0; }
#map { position:absolute; top:0; bottom:0; width:100%; }
</style>
</head>
<body>
<div id='map'></div>
<script>
mapboxgl.accessToken = 'your token';//mapbox The official website can obtain
var simple = {
"version": 8,
"sources": {
"composite": {
"url": "mapbox://mapbox.mapbox-terrain-v2",
"type": "vector"
},
"os": {
"type": "vector",
"scheme": "tms",
"tiles": [
"http://localhost:8088/geoserver/gwc/service/tms/1.0.0/myspace:[email protected]:[email protected]/{z}/{x}/{y}.pbf"
]
},
},
"sprite": "your sprite",
"glyphs": "your glyphs",
"layers": [
{
"id": "background",
"type": "background",
"paint": {
"background-color": "#ffffff"
},
"interactive": true
},
{
"id": "c",
"type": "fill",
"source": "os",
"source-layer": "bou2_4p",
"paint": {
"fill-color": "#C1FFC1",
"fill-opacity": 0.5
},
"interactive": true
},
{
"id": "mountain",
"type": "line",
"source": "os",
"source-layer": "m",
"layout": {
"line-join": "round",
"line-cap": "round"
},
"paint": {
"line-color": "#3031ff",
"line-width": {
"stops": [[6,0.4], [8, 0.6], [13, 1]]
},
"line-dasharray": [1.5,3]
}
},
{
"id": "province",
"type": "symbol",
"source": "os",
"source-layer": "province",
"layout": {
"symbol-spacing": 1000,
"text-field": "{NAME}",
"text-size": 15,
"text-font": ["SimHei Regular"],
"text-padding":2
},
"paint": {
"text-color": "rgb(100,82,45)",
"text-halo-color": "rgb(255,255,255)",
"text-halo-width": 1,
},
"interactive": true
}
]
};
var map = new mapboxgl.Map({
container: 'map',
style: simple,
zoom:3.5,
center: [114.08,29.54]
});
</script>
</body>
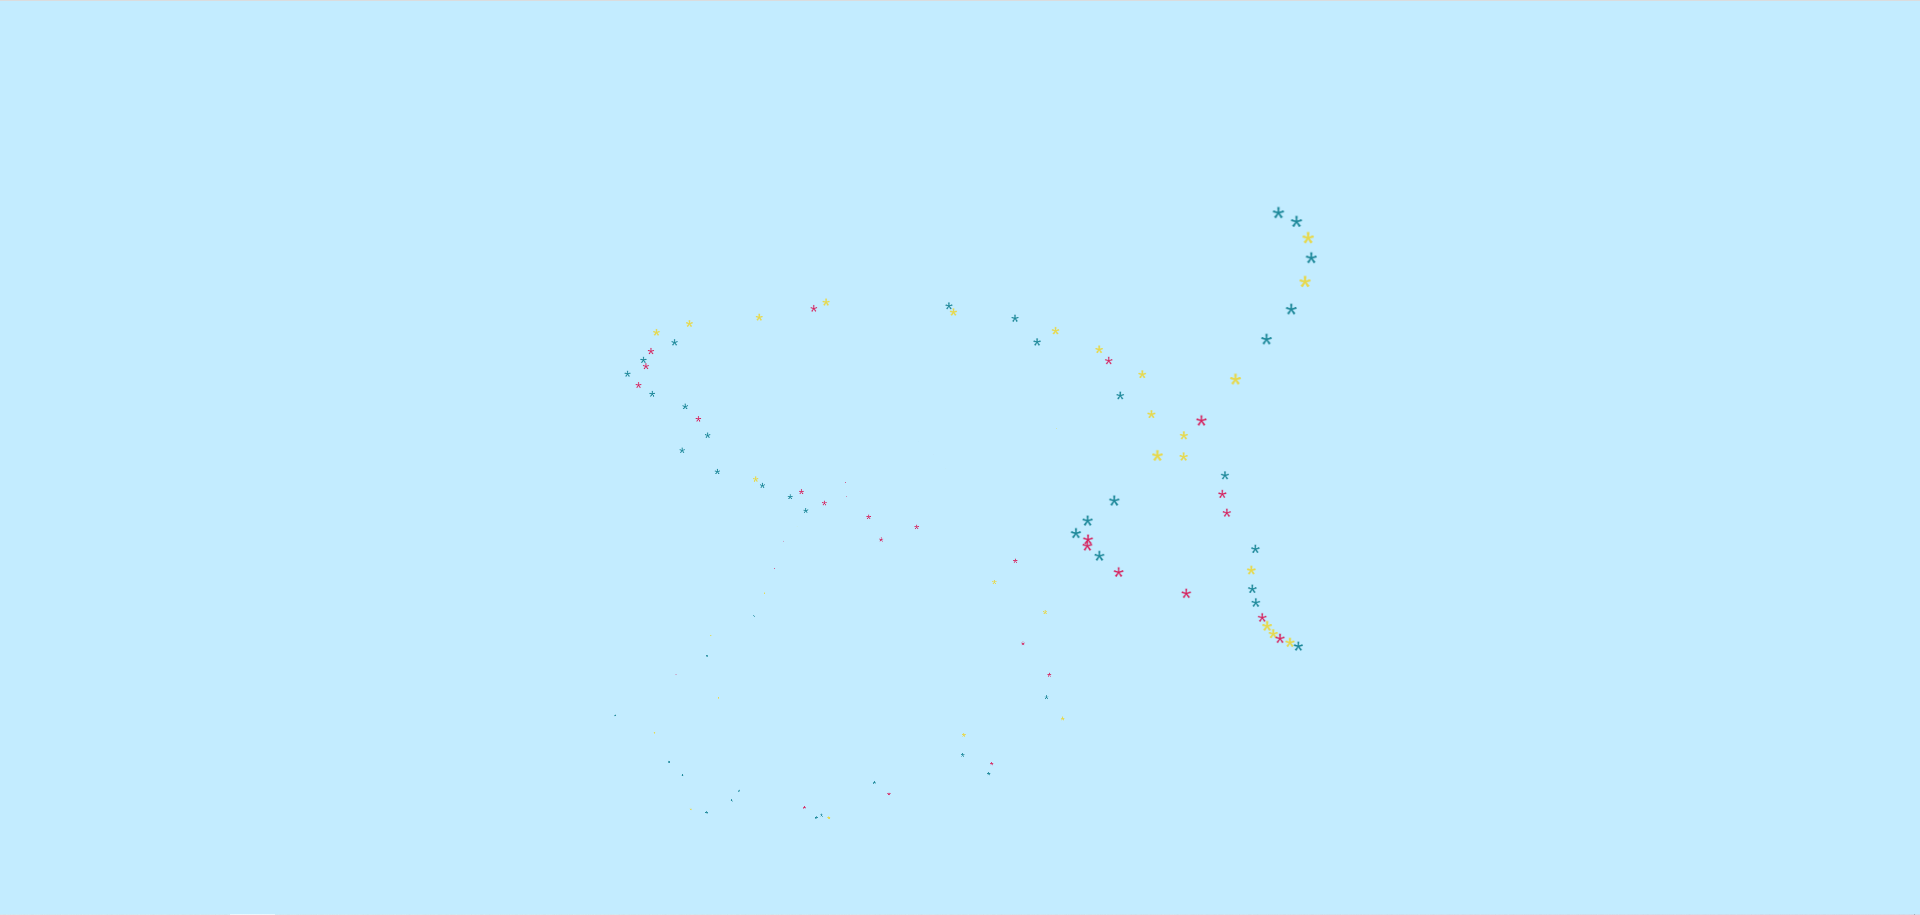
</html>7、 ... and 、 Effect display
The effect display is different from that written in the above steps , The picture below is in mapbox Your published services are superimposed on your map . The above steps can be made into a simple local map , The basic steps are listed above , Point, line and surface data loading formats are available , If you want to make it more delicate , Advice to see api.
边栏推荐
- Install pytoch+anaconda+cuda+cudnn
- canvas - 填充
- jsp标签
- 自定义MVC 1.0
- 设计一个函数print打印字符串,如果只传string型参数s,则字符串长度跟10比较,大于10,打印前10个字符,小于10,全部输出s;如果传string型参数s和int型n,则字符串长度跟n比
- Draw a moving teapot on the screen. The teapot first moves slowly towards the screen, becoming smaller and smaller, becoming more and more blurred; Then it grows bigger and clearer, and keeps repeatin
- 赶紧进来!!轻松掌握C语言“顺序”、“分支”、“循环”三大结构
- 8.使用二次几何体技术,在屏幕上绘制一个上小下大的柱体。
- 数据类型概括
- 微信小程序报错request:fail -2:net::ERR_FAILED
猜你喜欢


随机推荐
程序员工具合集!(转载)
special effects - 鼠标移动,出现自定义的表情拖尾
Cmake笔记
总结Browser对象
Geoserver自动化上传Shapefile
canvas - 圆形
PyCharm设置代码模板
MySQL的使用
输入10个人的名字,按从大到小排序输出
登录 页面 + 总结心得
Draw a moving teapot on the screen. The teapot first moves slowly towards the screen, becoming smaller and smaller, becoming more and more blurred; Then it grows bigger and clearer, and keeps repeatin
canvas - 旋转
JS输出字符串中出现最多次数的字符
Ain 0722 sign in
3. Draw a five sided cone with a square bottom on the screen. The bottom of the cone is on the xoz plane and the top of the cone is on the Y axis. Use the following figure to map the texture of the fo
useRef 创建动态引用
canvas - 填充
Draw a circle and a square on the screen. The square is in front and the circle is behind. You can move the square through the keyboard. In the following cases, the square can only move within the cir
MySQL之CRUD
设计一个函数print打印字符串,如果只传string型参数s,则字符串长度跟10比较,大于10,打印前10个字符,小于10,全部输出s;如果传string型参数s和int型n,则字符串长度跟n比