当前位置:网站首页>Use elk to save syslog, NetFlow logs and audit network interface traffic
Use elk to save syslog, NetFlow logs and audit network interface traffic
2022-06-23 01:26:00 【Halyace】
brief introduction
ELK Three abbreviations of open source software , respectively :Elasticsearch , Logstash, Kibana , They are all open source software . Later, a new one was added Beats, It is a lightweight log collection and processing tool (Agent),Beats Less occupied resources , It is suitable for collecting logs on various servers and sending them to Logstash, The official also recommends this tool .
- Elasticsearch It's an open source distributed search engine , Its characteristics are : Distributed , Zero configuration , Auto discovery , Index auto sharding , Index copy mechanism ,restful Style interface , Multiple data sources , Automatic search load etc .
- Logstash Is an open source data collection engine . It can dynamically unify data from different sources , And standardize the data to the target output of your choice . It provides a lot of plug-ins , It can help us analyze , Enrich , Convert and buffer any type of data .
- Kibana Is an open source analysis and visualization platform , It can be Logstash and ElasticSearch Provides log analysis friendly Web Interface , Can help you summarize 、 Analyze and search important data logs .
- Beats Is a lightweight log collector , In the early ELK Use... In the architecture Logstash collect 、 Parsing log , however Logstash On memory 、cpu、io The consumption of resources is relatively high . comparison Logstash,Beats Of the system CPU And memory is almost negligible .Beats The collection has 7 Member tools , among Packetbeat Is responsible for collecting network traffic logs .
One 、 download
Mirror:https://mirrors.aliyun.com/elasticstack/
Logstash:https://www.elastic.co/cn/downloads/logstash
Elasticsearch:https://www.elastic.co/cn/downloads/elasticsearch
Kibana:https://www.elastic.co/cn/downloads/kibana
Beats:https://www.elastic.co/cn/downloads/beats/
Beats-Packetbeat:https://www.elastic.co/cn/downloads/beats/packetbeat
Two 、 Environmental Science
- System :openEuler 20.03 LTS SP2
- network card 1:ens33
- IP Address :172.25.53.160/24
- network card 2:ens37
- IP Address : nothing As an audit interface
3、 ... and 、 install Logstash、Elasticsearch、Kibana
#  Create directory
mkdir -p /opt/softs
#  Go to the package directory
cd /opt/softs
#  Upload or download the installation package
wget https://artifacts.elastic.co/downloads/logstash/logstash-7.15.2-x86_64.rpm
wget https://artifacts.elastic.co/downloads/elasticsearch/elasticsearch-7.15.2-x86_64.rpm
wget https://artifacts.elastic.co/downloads/kibana/kibana-7.15.2-x86_64.rpm
#  install logstash
rpm -ivh logstash-7.15.2-x86_64.rpm
#  install elasticsearch
rpm -ivh elasticsearch-7.15.2-x86_64.rpm
#  install kibana
rpm -ivh kibana-7.15.2-x86_64.rpm
Four 、 To configure Elasticsearch
#  Move data directory
mv /var/lib/elasticsearch /opt/
#  Modify the configuration file
vi /etc/elasticsearch/elasticsearch.yml
- elasticsearch.yml Reference resources
#  Data directory
path.data: /opt/elasticsearch
#  Log directory
path.logs: /var/log/elasticsearch
#  Cluster name
cluster.name: "cluster01"
#  Cluster pattern : A single node
discovery.type:  "single-node"
#  binding IP For all IP
network.bind_host: 0.0.0.0
#  Turn on Safety Management
xpack.security.enabled: true
#  start-up elasticsearch service
systemctl start elasticsearch.service
#  Set the password
/usr/share/elasticsearch/bin/elasticsearch-setup-passwords interactive
Built in user name :
- elastic The super user
- apm_system APM Monitoring users
- kibana_system Kibana user
- logstash_system Logstash user
- beats_system Beats user
- remote_monitoring_user Remote monitoring users
5、 ... and 、 To configure Logstash
#  Move logstash Catalog
mv /var/lib/logstash /opt/
#  Modify the service configuration file
vi /etc/logstash/logstash.yml
- logstash.yml Reference resources
#  Data directory
path.data: /opt/logstash
#  Log directory
path.logs: /var/log/logstash
#  Create a log profile
touch /etc/logstash/conf.d/syslog.conf
#  Edit log profile
vi /etc/logstash/conf.d/syslog.conf
- syslog.conf Reference resources
#  Log entry
input {

  #  monitor TCP UDP 1514 Port to receive syslog journal
  syslog  {

    type => syslog
    port => 1514
    timezone => "Asia/Shanghai"
  }
  #  monitor TCP UDP 2055 Port to receive netflow journal
  syslog  {

    type => netflow
    port => 2055
    codec => netflow
    timezone => "Asia/Shanghai"
  }
}

#  Log processing filtering
filter  {

  #  Judge that the type of log input part is syslog Log
  if [type] == "syslog"{

    # grok Filter plug in   It is mainly used to extract the contents of fields and generate new fields   See below for details grok Plug in Chapter
    grok {

      match =>{

        "message" =>".*source-ip=%{IPV4:src_ip}.*source-port=%{POSINT:src_port}.*destination-ip=%{IPV4:dst_ip}.*destination-port=%{POSINT:dst_port}.*time=(?<time>(%{YEAR}\/%{MONTHNUM}\/%{MONTHDAY}\s+%{TIME})).*"
      }
    }
    # date Filter plug in   It is mainly used to refresh the timestamp field of the log   Specific reference date Plug in Chapter
    date{

      match => [ "time", "MMM dd HH:mm:ss"]
      locale => "en"
      add_tag => "@timestamp"
      timezone => "Asia/Shanghai"
    }
  }
  #  Judge that the type of log input part is netflow Log
  if [type] == "netflow"{

    # date Filter plug in   It is mainly used to refresh the timestamp field of the log   Specific reference date Plug in Chapter
    date{

      match => [ "flowStartSeconds", "UNIX"]
      locale => "en"
      add_tag => "@timestamp"
      timezone => "Asia/Shanghai"
    }
  }
}

#  Log output
output {

  #  Determine the log type  syslog
  if [type] == "syslog"{

    #  Determine the log source host IP Address   Only the required source hosts are output   Such as : test machine
    if [host] == "10.0.0.3" {

      #  Output to elasticsearch
      elasticsearch {

        # elasticsearch  agreement   host   port
        hosts => ["http://127.0.0.1:9200"]
        #  Index name
        index => "syslog-%{[host]}-%{+YYYY.MM.dd}"
        # elasticsearch user name
        user => "elastic"
        # elasticsearch password
        password => " User password "
      }
    }
  }
  #  Determine the log type  netflow
  if [type] == "netflow"{

    if [host] == "10.0.0.3" {

      elasticsearch {

        hosts => ["http://127.0.0.1:9200"]
        index => "netflow-%{[host]}-%{+YYYY.MM.dd}"
        user => "elastic"
        password => " User password "
      }
    }
  }
  #  Log output to the console ( Uncomment when debugging to use )
  #stdout {

  # codec => rubydebug
  #}
}
- grok plug-in unit
grok The plug-in will generate new fields according to the contents of the built-in regular or custom regular extraction fields .
Official documents :https://www.elastic.co/guide/en/logstash/current/plugins-filters-grok.html
Example
Raw data :source-ip=192.168.0.1 source-port=12345
expression :source-ip=%{IPV4:src_ip}\s+source-port=%{POSINT:src_port}
Can extract IP Address 192.168.0.1 Put in src_ip Field
Can extract 12345 The port is put into src_port Field
among IPV4 and POSINT For predefined rules
- grok Built in rules
Reference resources :https://github.com/elastic/logstash/blob/v1.4.2/patterns/grok-patterns
USERNAME [a-zA-Z0-9._-]+
USER %{USERNAME}
INT (?:[+-]?(?:[0-9]+))
BASE10NUM (?<![0-9.+-])(?>[+-]?(?:(?:[0-9]+(?:\.[0-9]+)?)|(?:\.[0-9]+)))
NUMBER (?:%{BASE10NUM})
BASE16NUM (?<![0-9A-Fa-f])(?:[+-]?(?:0x)?(?:[0-9A-Fa-f]+))
BASE16FLOAT \b(?<![0-9A-Fa-f.])(?:[+-]?(?:0x)?(?:(?:[0-9A-Fa-f]+(?:\.[0-9A-Fa-f]*)?)|(?:\.[0-9A-Fa-f]+)))\b

POSINT \b(?:[1-9][0-9]*)\b
NONNEGINT \b(?:[0-9]+)\b
WORD \b\w+\b
NOTSPACE \S+
SPACE \s*
DATA .*?
GREEDYDATA .*
QUOTEDSTRING (?>(?<!\\)(?>"(?>\\.|[^\\"]+)+"|""|(?>'(?>\\.|[^\\']+)+')|''|(?>`(?>\\.|[^\\`]+)+`)|``))
UUID [A-Fa-f0-9]{8}-(?:[A-Fa-f0-9]{4}-){3}[A-Fa-f0-9]{12}

# Networking
MAC (?:%{CISCOMAC}|%{WINDOWSMAC}|%{COMMONMAC})
CISCOMAC (?:(?:[A-Fa-f0-9]{4}\.){2}[A-Fa-f0-9]{4})
WINDOWSMAC (?:(?:[A-Fa-f0-9]{2}-){5}[A-Fa-f0-9]{2})
COMMONMAC (?:(?:[A-Fa-f0-9]{2}:){5}[A-Fa-f0-9]{2})
IPV6 ((([0-9A-Fa-f]{1,4}:){7}([0-9A-Fa-f]{1,4}|:))|(([0-9A-Fa-f]{1,4}:){6}(:[0-9A-Fa-f]{1,4}|((25[0-5]|2[0-4]\d|1\d\d|[1-9]?\d)(\.(25[0-5]|2[0-4]\d|1\d\d|[1-9]?\d)){3})|:))|(([0-9A-Fa-f]{1,4}:){5}(((:[0-9A-Fa-f]{1,4}){1,2})|:((25[0-5]|2[0-4]\d|1\d\d|[1-9]?\d)(\.(25[0-5]|2[0-4]\d|1\d\d|[1-9]?\d)){3})|:))|(([0-9A-Fa-f]{1,4}:){4}(((:[0-9A-Fa-f]{1,4}){1,3})|((:[0-9A-Fa-f]{1,4})?:((25[0-5]|2[0-4]\d|1\d\d|[1-9]?\d)(\.(25[0-5]|2[0-4]\d|1\d\d|[1-9]?\d)){3}))|:))|(([0-9A-Fa-f]{1,4}:){3}(((:[0-9A-Fa-f]{1,4}){1,4})|((:[0-9A-Fa-f]{1,4}){0,2}:((25[0-5]|2[0-4]\d|1\d\d|[1-9]?\d)(\.(25[0-5]|2[0-4]\d|1\d\d|[1-9]?\d)){3}))|:))|(([0-9A-Fa-f]{1,4}:){2}(((:[0-9A-Fa-f]{1,4}){1,5})|((:[0-9A-Fa-f]{1,4}){0,3}:((25[0-5]|2[0-4]\d|1\d\d|[1-9]?\d)(\.(25[0-5]|2[0-4]\d|1\d\d|[1-9]?\d)){3}))|:))|(([0-9A-Fa-f]{1,4}:){1}(((:[0-9A-Fa-f]{1,4}){1,6})|((:[0-9A-Fa-f]{1,4}){0,4}:((25[0-5]|2[0-4]\d|1\d\d|[1-9]?\d)(\.(25[0-5]|2[0-4]\d|1\d\d|[1-9]?\d)){3}))|:))|(:(((:[0-9A-Fa-f]{1,4}){1,7})|((:[0-9A-Fa-f]{1,4}){0,5}:((25[0-5]|2[0-4]\d|1\d\d|[1-9]?\d)(\.(25[0-5]|2[0-4]\d|1\d\d|[1-9]?\d)){3}))|:)))(%.+)?
IPV4 (?<![0-9])(?:(?:25[0-5]|2[0-4][0-9]|[0-1]?[0-9]{1,2})[.](?:25[0-5]|2[0-4][0-9]|[0-1]?[0-9]{1,2})[.](?:25[0-5]|2[0-4][0-9]|[0-1]?[0-9]{1,2})[.](?:25[0-5]|2[0-4][0-9]|[0-1]?[0-9]{1,2}))(?![0-9])
IP (?:%{IPV6}|%{IPV4})
HOSTNAME \b(?:[0-9A-Za-z][0-9A-Za-z-]{0,62})(?:\.(?:[0-9A-Za-z][0-9A-Za-z-]{0,62}))*(\.?|\b)
HOST %{HOSTNAME}
IPORHOST (?:%{HOSTNAME}|%{IP})
HOSTPORT %{IPORHOST}:%{POSINT}

# paths
PATH (?:%{UNIXPATH}|%{WINPATH})
UNIXPATH (?>/(?>[\w_%[email protected]:.,-]+|\\.)*)+
TTY (?:/dev/(pts|tty([pq])?)(\w+)?/?(?:[0-9]+))
WINPATH (?>[A-Za-z]+:|\\)(?:\\[^\\?*]*)+
URIPROTO [A-Za-z]+(\+[A-Za-z+]+)?
URIHOST %{IPORHOST}(?::%{POSINT:port})?
# uripath comes loosely from RFC1738, but mostly from what Firefox
# doesn't turn into %XX
URIPATH (?:/[A-Za-z0-9$.+!*'(){},~:;[email protected]#%_\-]*)+
#URIPARAM \?(?:[A-Za-z0-9]+(?:=(?:[^&]*))?(?:&(?:[A-Za-z0-9]+(?:=(?:[^&]*))?)?)*)?
URIPARAM \?[A-Za-z0-9$.+!*'|(){},[email protected]#%&/=:;_?\-\[\]]*
URIPATHPARAM %{URIPATH}(?:%{URIPARAM})?
URI %{URIPROTO}://(?:%{USER}(?::[^@]*)[email protected])?(?:%{URIHOST})?(?:%{URIPATHPARAM})?

# Months: January, Feb, 3, 03, 12, December
MONTH \b(?:Jan(?:uary)?|Feb(?:ruary)?|Mar(?:ch)?|Apr(?:il)?|May|Jun(?:e)?|Jul(?:y)?|Aug(?:ust)?|Sep(?:tember)?|Oct(?:ober)?|Nov(?:ember)?|Dec(?:ember)?)\b
MONTHNUM (?:0?[1-9]|1[0-2])
MONTHNUM2 (?:0[1-9]|1[0-2])
MONTHDAY (?:(?:0[1-9])|(?:[12][0-9])|(?:3[01])|[1-9])

# Days: Monday, Tue, Thu, etc...
DAY (?:Mon(?:day)?|Tue(?:sday)?|Wed(?:nesday)?|Thu(?:rsday)?|Fri(?:day)?|Sat(?:urday)?|Sun(?:day)?)

# Years?
YEAR (?>\d\d){1,2}
HOUR (?:2[0123]|[01]?[0-9])
MINUTE (?:[0-5][0-9])
# '60' is a leap second in most time standards and thus is valid.
SECOND (?:(?:[0-5]?[0-9]|60)(?:[:.,][0-9]+)?)
TIME (?!<[0-9])%{HOUR}:%{MINUTE}(?::%{SECOND})(?![0-9])
# datestamp is YYYY/MM/DD-HH:MM:SS.UUUU (or something like it)
DATE_US %{MONTHNUM}[/-]%{MONTHDAY}[/-]%{YEAR}
DATE_EU %{MONTHDAY}[./-]%{MONTHNUM}[./-]%{YEAR}
ISO8601_TIMEZONE (?:Z|[+-]%{HOUR}(?::?%{MINUTE}))
ISO8601_SECOND (?:%{SECOND}|60)
TIMESTAMP_ISO8601 %{YEAR}-%{MONTHNUM}-%{MONTHDAY}[T ]%{HOUR}:?%{MINUTE}(?::?%{SECOND})?%{ISO8601_TIMEZONE}?
DATE %{DATE_US}|%{DATE_EU}
DATESTAMP %{DATE}[- ]%{TIME}
TZ (?:[PMCE][SD]T|UTC)
DATESTAMP_RFC822 %{DAY} %{MONTH} %{MONTHDAY} %{YEAR} %{TIME} %{TZ}
DATESTAMP_RFC2822 %{DAY}, %{MONTHDAY} %{MONTH} %{YEAR} %{TIME} %{ISO8601_TIMEZONE}
DATESTAMP_OTHER %{DAY} %{MONTH} %{MONTHDAY} %{TIME} %{TZ} %{YEAR}
DATESTAMP_EVENTLOG %{YEAR}%{MONTHNUM2}%{MONTHDAY}%{HOUR}%{MINUTE}%{SECOND}

# Syslog Dates: Month Day HH:MM:SS
SYSLOGTIMESTAMP %{MONTH} +%{MONTHDAY} %{TIME}
PROG (?:[\w._/%-]+)
SYSLOGPROG %{PROG:program}(?:\[%{POSINT:pid}\])?
SYSLOGHOST %{IPORHOST}
SYSLOGFACILITY <%{NONNEGINT:facility}.%{NONNEGINT:priority}>
HTTPDATE %{MONTHDAY}/%{MONTH}/%{YEAR}:%{TIME} %{INT}

# Shortcuts
QS %{QUOTEDSTRING}

# Log formats
SYSLOGBASE %{SYSLOGTIMESTAMP:timestamp} (?:%{SYSLOGFACILITY} )?%{SYSLOGHOST:logsource} %{SYSLOGPROG}:
COMMONAPACHELOG %{IPORHOST:clientip} %{USER:ident} %{USER:auth} \[%{HTTPDATE:timestamp}\] "(?:%{WORD:verb} %{NOTSPACE:request}(?: HTTP/%{NUMBER:httpversion})?|%{DATA:rawrequest})" %{NUMBER:response} (?:%{NUMBER:bytes}|-)
COMBINEDAPACHELOG %{COMMONAPACHELOG} %{QS:referrer} %{QS:agent}

# Log Levels
LOGLEVEL ([Aa]lert|ALERT|[Tt]race|TRACE|[Dd]ebug|DEBUG|[Nn]otice|NOTICE|[Ii]nfo|INFO|[Ww]arn?(?:ing)?|WARN?(?:ING)?|[Ee]rr?(?:or)?|ERR?(?:OR)?|[Cc]rit?(?:ical)?|CRIT?(?:ICAL)?|[Ff]atal|FATAL|[Ss]evere|SEVERE|EMERG(?:ENCY)?|[Ee]merg(?:ency)?)
- date plug-in unit
date The plug-in is mainly used to extract the date and time in the field, convert it into the corresponding format and store it in some fields , By default, it is stored in @timestamp Field .
Official documents :https://www.elastic.co/guide/en/logstash/current/plugins-filters-date.html - date Built in rules
| character | paraphrase | Example |
|---|---|---|
| ISO8601 | Parse any valid ISO8601 Time | 2011-04-19T03:44:01.103Z |
| UNIX | Parse floating point or integer 10 A time stamp | 1326149001 |
| UNIX_MS | Analytic shaping 13 A time stamp | 1326149001000 |
| TAI64N | analysis TAI64N Time | |
| yyyy | 4 Bit year | 2021 |
| yy | 2 Bit year | 21 |
| M | 1 Bit or 2 Bit month | 2 |
| MM | 2 Bit month | 02 |
| MMM | Abbreviation: month | Feb |
| MMMM | Full month | February |
| d | 1 Bit or 2 Bit day | 5 |
| dd | 2 Bit day | 05 |
| H | 1 Bit or 2 Bit hour | 9 |
| HH | 2 Bit hour | 09 |
| m | 1 Bit or 2 Bit minute | 8 |
| mm | 2 Bit minute | 08 |
| s | 1 Bit or 2 Bit second | 6 |
| ss | 2 Bit second | 06 |
| S | One tenth of a second | 4 |
| SS | One hundredth of a second | 40 |
| SSS | One thousandth of a second | 400 |
| Z | The time zone | -0700 |
| ZZ | The time zone | -07:00 |
| ZZZ | Time zone identification | Asia/Shanghai |
| w | Weeks of the year | 1 |
| ww | 2 The week of the year | 01 |
| D | The day of the year | 245 |
| e | What day | 7 |
| E,EE,EEE | English abbreviation day of the week | Sun |
| EEEE | Day of the week | Tuesday |
#  Test the configuration file for errors
/usr/share/logstash/bin/logstash -f /etc/logstash/conf.d/syslog.conf --config.test_and_exit
#  Turn off firewall temporarily
systemctl stop firewalld
#  Cancel /etc/logstash/conf.d/syslog.conf Console output comments in the output section of the configuration file
#  Temporarily start in the form of configuration file hot load   Test whether to input and output logs
/usr/share/logstash/bin/logstash -f /etc/logstash/conf.d/syslog.conf --config.reload.automatic
- Use telnet Or other debugging tools tcp or udp Package to 1514 Whether the port test is normal input and output
Test data :
<123>Dec 8 2021 06:10:48 USG6600E:vsys=public, protocol=6, source-ip=172.16.1.2, source-port=63354, destination-ip=172.16.1.1, destination-port=80, time=2021/12/8 14:10:48.

#  After successful analysis Ctrl+C Turn off temporary startup
# /etc/logstash/conf.d/syslog.conf The console output in the output section of the configuration file is commented out
#  start-up logstash service
systemctl start logstash.service
6、 ... and 、 To configure Kibana
#  Modify the configuration file
vi /etc/kibana/kibana.yml
- kibana.yml Reference resources
#  Listening port
server.port: 5601
#  binding IP
server.host: "0.0.0.0"
# elasticsearch user name
elasticsearch.username: "kibana_system"
# elasticsearch password
elasticsearch.password: " User password "
#  Open Chinese
i18n.locale: "zh-CN"
#  Set up URL Full name
server.publicBaseUrl: "http://172.25.53.160:5601"
#  Start the service
systemctl start kibana.service
7、 ... and 、 Configure firewall
#  Turn on the firewall
systemctl start firewalld
#  Release port
firewall-cmd --zone=public --add-port=1514/udp --permanent
firewall-cmd --zone=public --add-port=1514/tcp --permanent
firewall-cmd --zone=public --add-port=2055/udp --permanent
firewall-cmd --zone=public --add-port=2055/tcp --permanent
firewall-cmd --zone=public --add-port=9200/tcp --permanent
firewall-cmd --zone=public --add-port=9300/tcp --permanent
firewall-cmd --zone=public --add-port=5601/tcp --permanent
#  Overloaded firewall
firewall-cmd --reload
- If needed from tcp 80 Port access kibana Port forwarding needs to be configured (1514 Forwarding to 514 Empathy )
- iptables Firewall port forwarding
# tcp80 Port forward to 5601
iptables -t nat -A PREROUTING -i ens33 -p tcp --dport 80 -j REDIRECT --to-port 5601
#  Save configuration
iptables-save
8、 ... and 、 Sign in Kibana
- Browser access http://172.25.53.160:5601 enter one user name elastic password ****** Sign in

- Click Browse by yourself

- Use telnet Or other debugging tools tcp or udp Package to 1514 Whether the port test is normal input and output
Test data :
<123>Dec 8 2021 06:10:48 USG6600E:vsys=public, protocol=6, source-ip=172.16.1.2, source-port=63354, destination-ip=172.16.1.1, destination-port=80, time=2021/12/8 14:10:48.
- Click on the menu bar on the left Management - Stack Management
- Click... In the secondary menu on the left data - Index management
- You can see that the index has been automatically created syslog-xxxxxx

- The single node deployment does not meet the requirements of replica fragmentation 1 So change the replica partition to 0 So the status is yellow
- Click on Index name - edit modify index.number_of_replicas The value of is 0 Then click save Status reverts to green

- Click the secondary menu on the left Kibana - Index mode
- Create index mode

- Enter a name syslog-* Match all syslog journal
- Select the timestamp field @timestamp
- Click create index mode

- First class menu Analytics - Discover You can view log data

- Click on the first level menu Observability - journal
- Click the settings button in the upper right corner

- Click on Use Kibana Index mode

- Select the index mode you created earlier
- According to the columns of the configuration log
- Application settings

- Click on the secondary menu Logs - Stream You can see 、 Search logs

Nine 、 Audit network interface traffic
9.1 install Packetbeat
#  Create directory
mkdir -p /opt/softs
#  Go to the package directory
cd /opt/softs
#  Upload or download the installation package
wget https://artifacts.elastic.co/downloads/beats/packetbeat/packetbeat-7.16.0-x86_64.rpm
#  install packetbeat
rpm -ivh packetbeat-7.16.0-x86_64.rpm
9.2 To configure Packetbeat
#  Modify the configuration file
vi /etc/packetbeat/packetbeat.yml
- packetbeat.yml Reference resources
……
#  Configure the audit network card interface   It can be all
packetbeat.interfaces.device: ens37
……
#  docking kibana
# =================================== Kibana ===================================
  host: "localhost:5601"
……
#  docking elasticsearch
# ---------------------------- Elasticsearch Output ----------------------------
output.elasticsearch:
  # elasticsearch Address and port
  hosts: ["localhost:9200"]
  #  user name
  username: "elastic"
  #  password
  password: " User password "
……
#  start-up packetbeat service
systemctl start packetbeat.service
#  Switch to packetbeat Catalog
cd /usr/share/packetbeat/bin
#  Add panels
packetbeat setup --dashboards
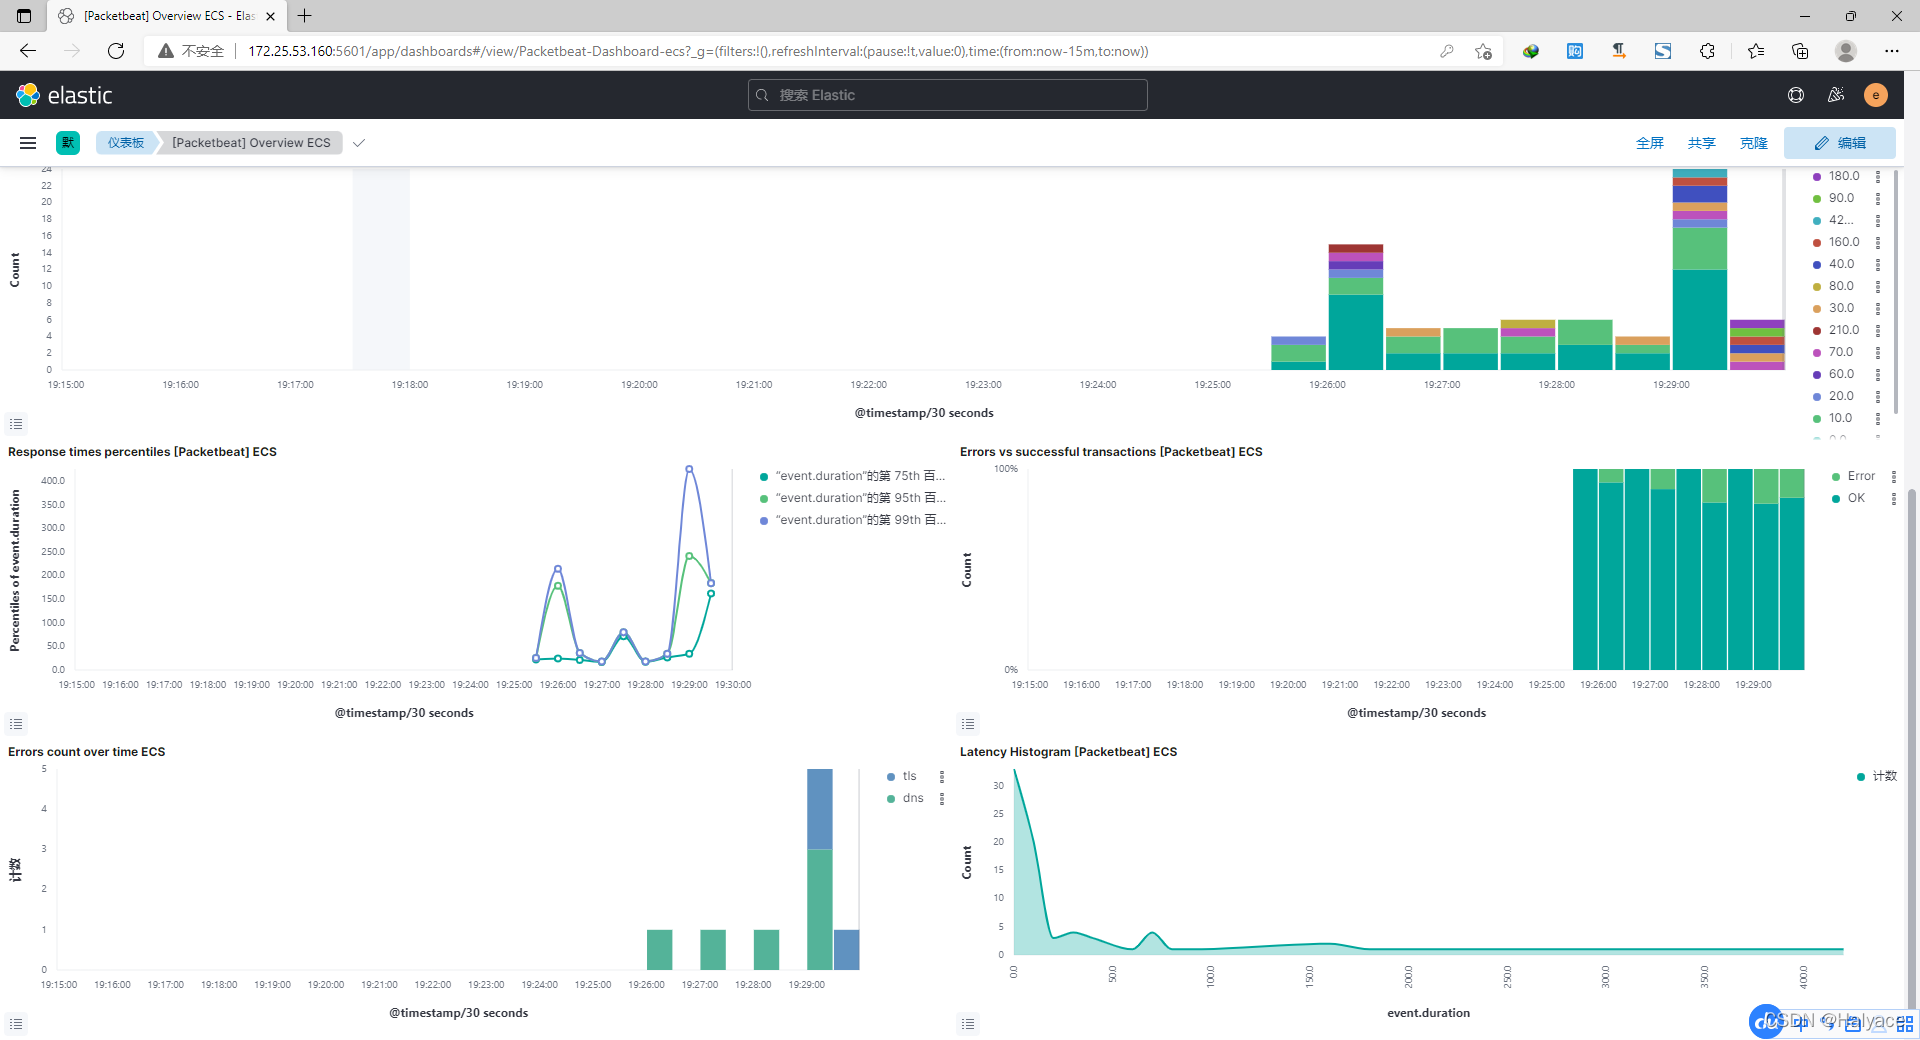
- Sign in Kibana First class menu Analytics - Dashboard You can see Packetbeat Built in panel

- [Packetbeat] Overview ECS panel
Ten 、 Set the power on auto start
#  Boot up automatically elasticsearch
systemctl enable elasticsearch.service
#  Boot up automatically logstash
systemctl enable logstash.service
#  Boot up automatically kibana
systemctl enable kibana.service
#  Boot up automatically packetbeat
systemctl enable packetbeat.service
边栏推荐
- [machine learning watermelon book] update challenge [Day1]: 1.1 INTRODUCTION
- SQL programming task06 assignment - Autumn recruit secret script ABC
- C#.NET万能数据库访问封装类(ACCESS、SQLServer、Oracle)
- It's still like this
- E-R diagram
- 62. different paths
- LINQ 查詢
- 3D printing microstructure
- Big guys, 2.2.1 the CDC monitoring SQLSEVER can only get the full amount of data. Why can't we get the incremental data in the later period
- Time complexity
猜你喜欢

Overview of visual object detection technology based on deep learning
Voice network multiplayer video recording and synthesis support offline re recording | Nuggets technology solicitation

How to set the power-off auto start of easycvr hardware box

Webdriver and selenium Usage Summary

MySQL-Seconds_ behind_ Master accuracy error

Analysis on the wallet system architecture of Baidu trading platform

New progress in the construction of meituan's Flink based real-time data warehouse platform

Read Amazon memorydb database based on redis

Explain the startup process of opengauss multithreading architecture in detail
![[initial launch] there are too many requests at once, and the database is in danger](/img/c1/807575e1340b8f8fe54197720ef575.png)
[initial launch] there are too many requests at once, and the database is in danger

随机推荐
Template specialization template <>
E-R图
Cadence spb17.4 - Chinese UI settings
Huawei cloud recruits partners in the field of industrial intelligence to provide strong support + commercial realization
C language student achievement ranking system
Pat class A - 1015 reversible primes
cadence SPB17.4 - allegro - 优化指定单条电气线折线连接角度 - 折线转圆弧
Leetcode question brushing - 715 Range module
You can also do NLP (classification)
Fluentd is easy to use. Combined with the rainbow plug-in market, log collection is faster
Project directory navigation
Installation record of ros1noetic in Win 11
LINQ query
[learning notes] roll back Mo team
SAP ui5 application development tutorial 103 - how to consume the trial version of the third-party library in SAP ui5 applications
SAP ui5 application development tutorial 103 - how to consume third-party libraries in SAP ui5 applications
使用aggregation API扩展你的kubernetes API
Shell logs and printouts
[machine learning watermelon book] update challenge [Day1]: 1.1 INTRODUCTION
[initial launch] there are too many requests at once, and the database is in danger