当前位置:网站首页>Wireshark TS | video app cannot play
Wireshark TS | video app cannot play
2022-06-23 05:55:00 【7ACE】
The problem background
This problem case comes from a friend sharing , The problem user responded to an online video APP By moving WIFI And traffic are not viewable , But Telecom traffic is normal . It feels like the reason why video services are blocked by mobile operators , But according to the analysis of the actual packet tracking file , The actual reason is not so .
ok , I'm wrong about you this time , Move ~ Simply record the troubleshooting process .
Problem information
telecom
Normal packet trace file (TV-01.pcapng) The basic information is as follows , Trace file in Windows through Wireshark Captured , Number of packets 1633, Average rate 776 kbps .
$ capinfos TV-01.pcapng
File name:           TV-01.pcapng
File type:           Wireshark/... - pcapng
File encapsulation:  Ethernet
File timestamp precision:  microseconds (6)
Packet size limit:   file hdr: (not set)
Number of packets:   1633
File size:           1556 kB
Data size:           1502 kB
Capture duration:    15.493249 seconds
First packet time:   2022-04-18 18:16:51.016785
Last packet time:    2022-04-18 18:17:06.510034
Data byte rate:      97 kBps
Data bit rate:       776 kbps
Average packet size: 920.37 bytes
Average packet rate: 105 packets/s
SHA256:              1b7e316c0c85084fcd5260bf514f4f68835f4c9d585499a4f815c2db00b9b0a0
RIPEMD160:           c439e8e92cbb016269267561734bd55dcda9b5cd
SHA1:                2299414bd2642647d0fb1ad2701a7370e648b1f0
Strict time order:   True
Capture hardware:           Intel(R) Core(TM) i3-3110M CPU @ 2.40GHz (with SSE4.2)
Capture oper-sys:    64-bit Windows 7 Service Pack 1, build 7601
Capture application: Dumpcap (Wireshark) 3.2.18 (v3.2.18-0-gddf8072b7671)
Number of interfaces in file: 1
Interface #0 info:
                     Name = \Device\NPF_{
    7861B556-A3C3-4557-AD97-65E9E8B3A8DC}
                     Description =  Wireless network connection
                     Encapsulation = Ethernet (1 - ether)
                     Capture length = 262144
                     Time precision = microseconds (6)
                     Time ticks per second = 1000000
                     Time resolution = 0x06
                     Operating system = 64-bit Windows 7 Service Pack 1, build 7601
                     Number of stat entries = 1
                     Number of packets = 1633
Move
Exception packet trace file (TV-02.pcapng) The basic information is as follows , Trace file in Windows The same goes for Wireshark Captured , Number of packets 803, The average rate is only 97 kbps , Contrast telecommunications is really abnormal , And video APP Play the displayed 0.0kb/s The problem phenomenon basically matches .
$ capinfos TV-02.pcapng
File name:           TV-02.pcapng
File type:           Wireshark/... - pcapng
File encapsulation:  Ethernet
File timestamp precision:  microseconds (6)
Packet size limit:   file hdr: (not set)
Number of packets:   803
File size:           489 kB
Data size:           461 kB
Capture duration:    37.704609 seconds
First packet time:   2022-04-18 17:53:51.743014
Last packet time:    2022-04-18 17:54:29.447623
Data byte rate:      12 kBps
Data bit rate:       97 kbps
Average packet size: 574.81 bytes
Average packet rate: 21 packets/s
SHA256:              5abadf00874c27d191feb9f84772867ed1b94a7a71e8295727fc4e5ee201bd02
RIPEMD160:           35a619df088164fadc413d4d223df30f9899e6f3
SHA1:                a41044db201276a7b1a2cb6dfd9545bc7848d9a4
Strict time order:   True
Capture hardware:           Intel(R) Core(TM) i3-3110M CPU @ 2.40GHz (with SSE4.2)
Capture oper-sys:    64-bit Windows 7 Service Pack 1, build 7601
Capture application: Dumpcap (Wireshark) 3.2.18 (v3.2.18-0-gddf8072b7671)
Number of interfaces in file: 1
Interface #0 info:
                     Name = \Device\NPF_{
    7861B556-A3C3-4557-AD97-65E9E8B3A8DC}
                     Description =  Wireless network connection
                     Encapsulation = Ethernet (1 - ether)
                     Capture length = 262144
                     Time precision = microseconds (6)
                     Time ticks per second = 1000000
                     Time resolution = 0x06
                     Operating system = 64-bit Windows 7 Service Pack 1, build 7601
                     Number of stat entries = 1
                     Number of packets = 803

Simple browsing combined with expert information , There is some disorder 、 Retransmission and fast retransmission .

Problem analysis
telecom
Enter the actual analysis of the data package , Start with normal telecommunications , Among them TCP Stream 4 The display is basically normal , Include TCP Three handshakes 、 client GET request 、 Server side HTTP 206 Response and video data transmission .


Move
Move exception packets , part TCP Stream There is an obvious suspected retransmission phenomenon , The following Stream 1 For example,
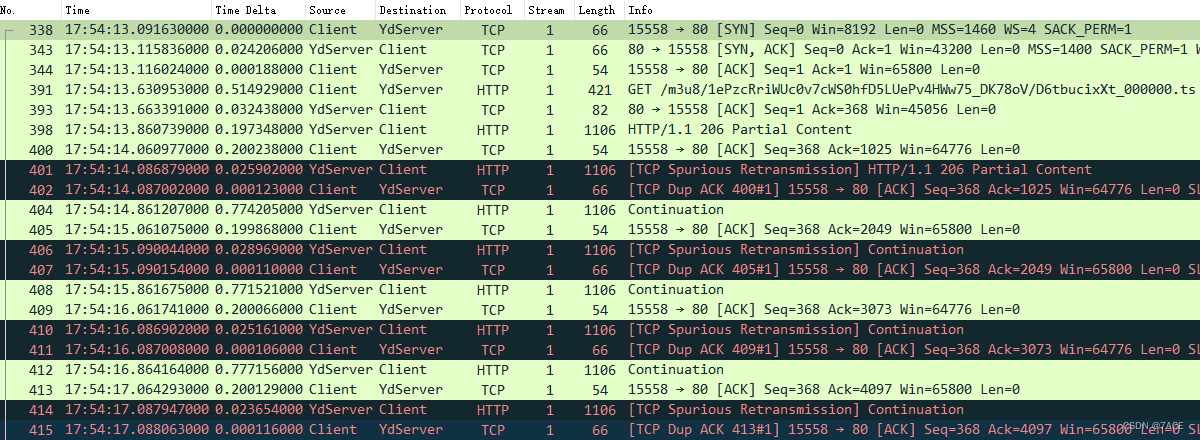
The fundamental analysis is as follows :
- Capture is done on the client , Because packets length Only 54 byte , The Ethernet frame minimum standard is not filled before the network card transmission 60 bytes ;
- TCP Three handshakes , among MSS 1400、SACK Support, etc ;
- TCP Suspected retransmission , The length is 1106 Byte packets are repeatedly suspected of retransmission and DUP ACK Problem phenomenon ;
- IRTT It's about time 24ms about .
What is? TCP Spurious Retransmission ? Actually, this is Wireshark An association analysis of context packets , To put it simply, I saw a TCP piecewise , You can also see the confirmation of this segment , One interaction has been completed once , But then I saw the same one TCP piecewise , For me, it belongs to suspected retransmission , It will trigger a DUP ACK Generate .
When Nagle In case of delay ACK
In fact, this question is a classic one When Nagle In case of delay ACK problem , The following is not Nagle Algorithm and delay ACK Do specific development , Quote some information on the Internet :
Nagle Algorithm
if there is new data to send
  if the window size >= MSS and available data is >= MSS
    send complete MSS segment now
  else
    if there is unconfirmed data still in the pipe
      enqueue data in the buffer until an acknowledge is received
    else
      send data immediately
    end if
  end if
end if
Specific measures :
- If the content sent is greater than or equal to 1 individual MSS, Immediately send ;
- If there was no bag before ACK, Immediately send ;
- If there's a bag that hasn't been ACK, Cache sent content ;
- If you receive ACK, Send the cached content immediately .
Delay ACK
TCP Delayed ACK( Delay confirmation ) In an effort to improve network performance , It will be a few ACK The responses are combined to form a single response , Or will ACK The response is sent to the other party along with the response data , Thus reducing the protocol overhead .
Specific measures :
- When there is response data to send ,ACK It will be sent to the other party immediately with the response data ;
- If there is no response data ,ACK Will delay sending , To wait to see if there is a response data that can be sent together ;
- If you're waiting to send ACK period , The other party's second packet arrived again , Send it immediately ACK. But if the other party's three packets arrive one after another , Whether to send the third segment as soon as it arrives ACK, It depends on the above two .
Nagle Algorithm and delay ACK
Back to the practical problem of mobile

Client and YdServer Data transfer : YdServer function Nagle Algorithm ,Client function Delayed ACK Algorithm .
If YdServer towards Client Send a packet No.398 ,Client because Delayed ACK Will not respond immediately . and YdServer Use Nagle Algorithm ,YdServer Will always wait for Client Of ACK,ACK No, I don't send the second packet , Then the request will be delayed 200ms, after Client Just sent No.400 ACK , and YdServer Because no confirmation can be received , the No.401 Over time retransmission , Therefore, the local packet capturing at the client is judged as a suspected retransmission ,Client The trigger produces No.402 DUP ACK.
Later on No.398、No.400-No.402 In this way 4 Packages have similar laws , repeated .
Repeat to No.602 and No.612 Then suddenly there was no such rule , Why? ? because RTO , Increase by dynamic adjustment , therefore No.612 ACK Back to YdServer after ,YdServer I haven't had time to retransmit . But the whole interaction because of this kind of abnormal problem , Causing slow data transmission , bring APP Not working properly , Page shows 0.0kb/s The phenomenon .

The problem summary
The problem YdServer It is CDN Mobile node server , Report the problem to the applicator , Later, it was rescheduled CDN The node returns to normal after . Therefore, in some application scenarios Nagle Algorithm and delay ACK, Please do not use it together ~
Question reference
https://blog.csdn.net/quality_C/article/details/122830119
https://blog.csdn.net/tianshouzhi/article/details/103884482
https://blog.csdn.net/chdhust/article/details/72852563
https://zhuanlan.zhihu.com/p/38687163
Thank you for reading , More technical articles can be concerned about official account numbers. :Echo Reply , thank you .
边栏推荐
- Real MySQL interview question (30) -- shell real estate order analysis
- 技术开发团队视角看到的数字藏品机遇与挑战
- JS interview question - anti shake function
- PAT 乙等 1014 C语言
- jvm-05.垃圾回收
- jvm-06.垃圾回收器
- Leetcode topic analysis: factorial training zeroes
- jvm-04.对象的内存布局
- TCP/IP 详解(第 2 版) 笔记 / 3 链路层 / 3.3 全双工, 节能, 自动协商机制, 802.1X 流控制 / 3.3.3 链路层流量控制
- Excel sheet column title for leetcode Title Resolution
猜你喜欢

Skill self check | do you know these 6 skills if you want to be a test leader?

True MySQL interview question (XXII) -- condition screening and grouping screening after table connection
C primer plus學習筆記 —— 2、常量與格式化IO(輸入/輸出)

Genetic engineering of AI art? Use # artbreeder to change any shape of the image
![[image fusion] sparse regularization based on non convex penalty to realize image fusion with matlab code](/img/e2/24eb2a60e3dc603b3ec4bfefd0b8e5.png)
[image fusion] sparse regularization based on non convex penalty to realize image fusion with matlab code

数字藏品到底有什么魔力?目前有哪些靠谱的团队在开发

Kotlin Android simple activity jump, simple combination of handler and thread

Real MySQL interview question (30) -- shell real estate order analysis

云原生数据库是未来

Wechat applet: unfashionable love talk
随机推荐
雷达图canvas
Real MySQL interview question (23) -- pinduoduo ball game analysis
Work accumulation - judge whether GPS is on
Low cost 5W wireless charger scheme fs68001b simple charging chip
Digital collections - new investment opportunities
MySQL面试真题(二十四)——行列互换
jvm-05.垃圾回收
Real MySQL interview questions (XXVII) -- Classification of users by RFM analysis method
云原生数据库是未来
Lottery DDD code
MySQL面试真题(二十六)——滴滴2020年笔试题
PAT 乙等 1011 C语言
Yingjixin launched 4 series of lithium batteries 100W mobile power supply voltage rise and fall scheme SOC chip ip5389
Kotlin Android simple activity jump, simple combination of handler and thread
Real MySQL interview questions (25) -- common group comparison scenarios
数字化工厂建设可划分为三个方面
MySQL面试真题(二十九)——案例-找到爱看的电影
MySQL面试真题(二十八)——案例-通讯运营商指标分析
JS interview question - anti shake function
The traditional Internet like platform may no longer exist, and a new industry integrating industrial characteristics and Internet characteristics