当前位置:网站首页>Introduction, download and use of global meteorological data CRU ts from 1901 to 2020
Introduction, download and use of global meteorological data CRU ts from 1901 to 2020
2022-06-24 18:41:00 【Geographical space of ruiduobao】
Data is introduced
CRU TS It is one of the most widely used climate data sets , By the National Centre for atmospheric science (NCAS) Make .CRU TS Provide global 1901 - 2020 Covering the land surface annually 0.5° Monthly data of resolution . This data set has 10 Set of data , Namely : temperature ( Average 、 minimum value 、 Maximum value and temperature difference between day and night )、 precipitation ( Total amount , Number of rainy days )、 humidity ( Such as vapor pressure )、 Frost days 、 Cloud cover and potential transpiration .

For the production method of the data, those who are interested can read the paper ,DOI:https://doi.org/10.1038/s41597-020-0453-3, Published in Nature’s Scientific Data On .
Data download
CRU TS Official website the data provided on the official website includes various versions , The data set has been updated to Version 4. Here's just how download 2020 year Precipitation data for .
Get into CRU TS Official website (https://crudata.uea.ac.uk/cru/data/hrg/), And click the local copy

Click on Main gridded data Download data :

Click on pre Download precipitation data :

The meanings of each word in the web page interface are shown in the following table , If you need to download the temperature 、 cloudiness 、 Frost days, etc , Find the corresponding data download

Click on pre after , We choose the latest nc Data sets , This data set contains global 2011 year -2020 Annual precipitation data :

Click to download , Slow and wait patiently . The data download is completed :

Data usage
Through data download , We got 2011 year -2020 Global precipitation data for , A resolution of 0.5°.
Let's take precipitation data as an example , Use arcgis Make 2020 Annual precipitation map of Sichuan Province in .
Here are the steps
1. Load image 、 Crop image 、 Projection
adopt arcgis Self contained nc File open tool opens precipitation data


Load the precipitation data of Sichuan Province

Use the crop tool , Crop the data in the data frame around Sichuan Province , Because interpolation will be performed in the following steps , Cut the area near Sichuan Province , You can use... In the data export function Export data frame :


Load the exported data into arcgis in :

At this time, the precipitation data is not projected , Add projection

According to the central longitude of Sichuan Province , Change the projection of the database to WGS_1984_UTM_Zone_48N:

You can see the display effect after converting the projection
Use the grid export tool , Give precipitation data projection

At this point we open the grid data , It has the size of the image grid .

2. get 2020 Annual average precipitation
The dataset includes 2011 year -2020 year , total 10 Annual precipitation data ,120 Band .2020 The data band sequence of the year is 109-120:


Load these bands to arcgis in , Use the pixel statistics tool , Get the annual precipitation of each grid point :

Get the annual precipitation based on each grid :

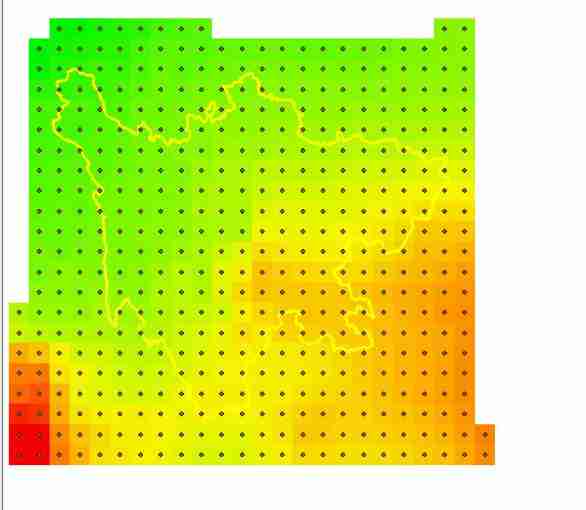
3. Make grid dots
This data is based on grid precipitation , We like to get higher resolution data , You can use interpolation . Before using interpolation , Use the grid to point tool to get pixels :

Because the interpolation will look at the values of the surrounding points , In fact, the range of grid data I choose here is smaller , Readers should try to extend the grid data to more grid points
4. Mesh interpolation
Select the grid resolution as needed , The setting here is 90m The resolution of the

The higher the resolution , The slower the speed , Wait patiently

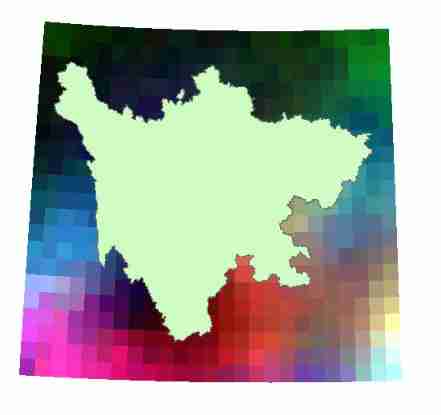
At this time, I got Sichuan Province 2020 Annual precipitation distribution in

5. drawing
Drawing is based on your own data and according to your requirements :

I only made a video of precipitation data production , You can see :
CRU
You can also view more data , stay “ Geoscience remote sensing data collection ” On .
边栏推荐
- What makes data analysts good- Cassie Kozyrkov
- How to use Fisher's least significant difference (LSD) in R
- Creating a new MySQL user in Amazon RDS environment - creating a new MySQL user in Amazon RDS environment
- An analysis of the comments on the TV series Douban by procedural apes
- Flex box flex attribute
- Two micro service interviews where small companies suffer losses
- [JS Framework] Failed to execute the callback function:
- Eight recommended microservice testing tools
- Sudoku (easy to understand)
- JS string method
猜你喜欢
Online sequence flow chart making tool

Vite+web3:报错出现ReferenceError: process is not defined

JS string method

JS deep understanding of scope

110. balanced binary tree

Window object

【leetcode】838. Push domino (Analog)

SAP license: ERP for supply chain management and Implementation

"2022" plans to change jobs and raise salary. It is necessary to ask interview questions and answers - browser

解决执行MapReduce程序控制台没有日志信息WARN Please initialize the log4j system properly

随机推荐
About whether arm's large and small end mode is related to CPU or compiler
Eight digit
应用程序DDoS攻击原理及防御方法
Data modeling technology of Business Intelligence BI
中电投先融期货这家公司怎么样?期货开户办理安全吗?
Solve the problem that the MapReduce program console does not have log information warn please initialize the log4j system properly
Rapidssl getting started SSL certificate
BOM(Browser Object Model)
Ultimate Guide: comprehensive analysis of log analysis architecture of Enterprise Cloud native PAAS platform
[golang] leetcode intermediate - jumping game & different paths
In depth learning of movement methods
Monotone stack template
Selection (033) - what is the output of the following code?
Selection (031) -cool_ How long can secret be accessed?
Leetcode daily question solution: 717 1-bit and 2-bit characters - reverse order
three.js创建的基础框架
[untitled]
JS position operation
Overall planning and construction method of digital transformation
Digital transformation informatization data planning and technology planning