当前位置:网站首页>Drawing library matplotlibmatplotlib quick start
Drawing library matplotlibmatplotlib quick start
2022-07-24 21:28:00 【Hua Weiyun】
Matplotlib What is it? ?
Matplotlib Is a comprehensive library , Used in Python Create static , Animated and interactive visual images .
at present (22 year 6 month ) The latest stable version is 3.5.2
install :
Use pip Installation
pip install matplotlib
Quick start
Let's first import matplotlib
import matplotlib as mplimport matplotlib.pyplot as pltimport numpy as np # use numpy Generate the data , Demonstrate as an example .Matplotlib In the figure (Figure)( for example , window ,Jupyter Small parts, etc ) Draw data on , A graph can contain one or more axis fields (Axes).
Axes It can be based on x-y Coordinates the drawing area of the specified point ( Or in polar coordinates θ-r,3D In the picture x-y-z etc. ). Create with Axes The easiest way to get a graph of is to use pyplot.subplots. then , We can use Axes.plot stay Axes Draw some data on :
x = [1,2,3,4]y = [1,4,3,2]fig,ax = plt.subplots() # Create a diagram fig, The default includes a axesax.plot(x,y) # draw x-y Line chart of plt.show() # Show the drawing . Please note that , If you use save Save the picture , Need to be in show Save before The line chart will be displayed after running :
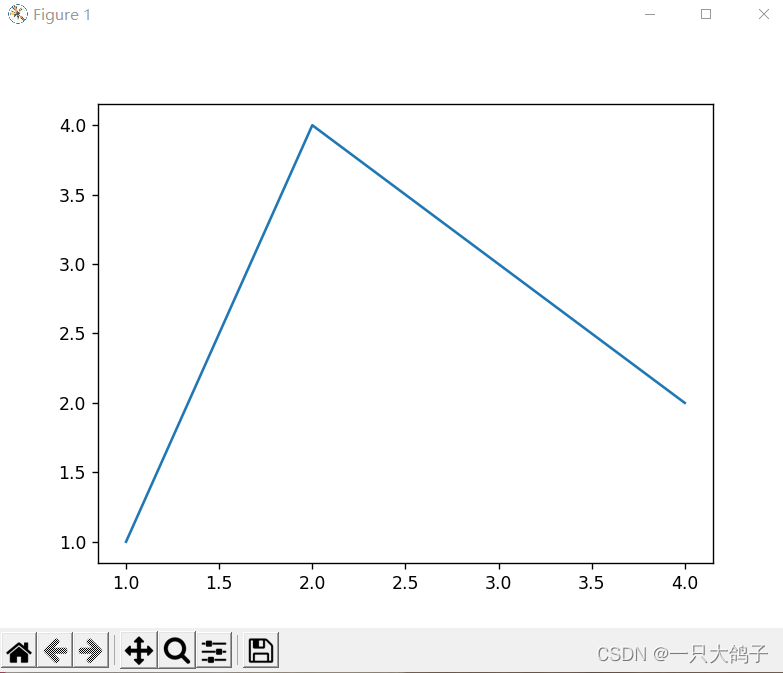
chart (Figure) Structure
A picture has the following parts : title (Title)、 legend (Legend)、x、y Axis labels (xlabel、ylabel) wait …
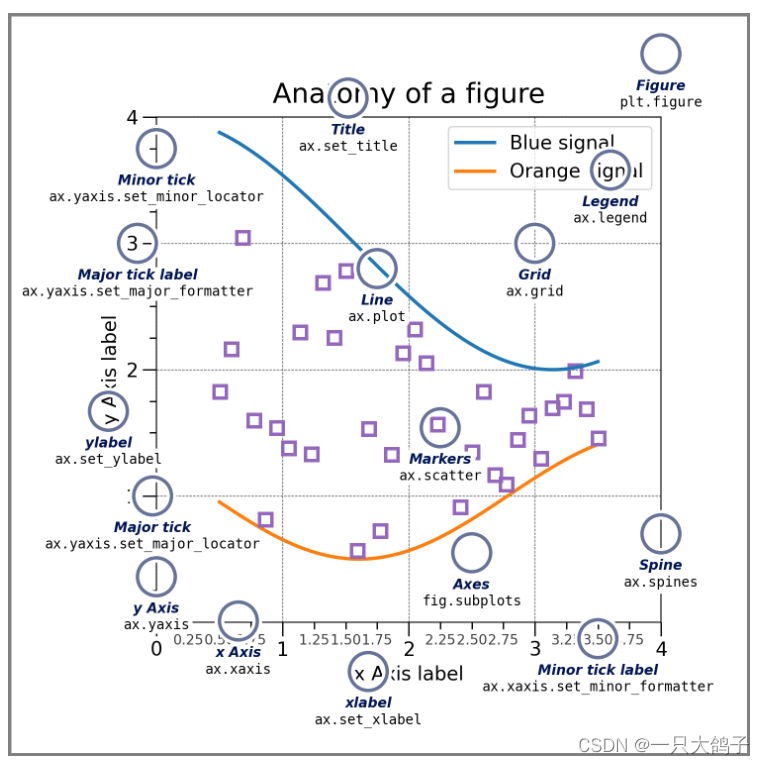
The following is a part by part introduction .
chart Figure
Complete image . This graph tracks all sub axis domains (Axes)---- A group of “ special ” Painting ( title , legend , Color bar, etc ), Even nested subgraphs .
The easiest way to create a new diagram is to use pyplot:
fig = plt.figure() # Empty graph , No, Axesfig, ax = plt.subplots() # Yes 1 individual Axesfig, axs = plt.subplots(2, 2) # Yes 2x2( Two lines and two columns ) individual AxesUsually , Set the axis field (Axes) And Figure It is convenient to create together , But you can also add the axis domain manually later .
Axis domain Axes
Axis domain (Axes) Is attached to the graph (Figure) On , Contains graphics for plotting data .
It usually includes two shafts (Axis) object . The two axes provide scales (ticks) And labels (tick label), To provide a scale for the data in the axis . Every Axis domain There's also a title ( adopt set_title()) Set up )、 One x label ( adopt set_xlabel()) Set up ) And a y label ( adopt set_ylabel()) Set up ).
Axes Class and its member functions use the OOP The main entry point of the interface , And most drawing methods are defined on it ( for example , As shown above , Use plot Method )ax.plot()
Axis Axis
Axis setting scale (scale) And limits (limits) And generate scales (ticks, Mark on shaft ) And scale labels (ticklabels, String marking the scale )ticks The position is determined by the positioner (Locator) determine ,ticklabel The string consists of Formatter (Formatter) Set up . Correct positioner (Locator) and Formatter (Formatter) The combination of can control the scale position and label very finely .
Artist
Artist Here it is translated into an artist or painter .
Basically , Everything visible on the graph is an artist ( Even graphics , Axis domain and Axis object ). This includes Text 、Line2D 、 aggregate 、Patch etc. . When rendering graphics , All artists will be drawn to canvas On . Most artists are associated with axis fields ; Such artists cannot be shared by multiple axis fields , Nor can it move from one axis to another .
Input data type of drawing function
Drawing function receives numpy.array or numpy.ma.masked_array As input , Or it can be passed to numpy.asarray The data of .pandas Data or numpy.matrix May not work properly . A common convention is to convert data into numpy.array. for example :
b = np.matrix([[1, 2], [3, 4]])b_asarray = np.asarray(b) # Use np.asarray() Convert it to np.array type Most methods can also resolve addressable objects , Such as dict,np.recarray or pandas.DataFrame.
Matplotlib Allow the use of keyword parameters to generate images , Transfer and x,y Corresponding string .
np.random.seed(19680801) # seed the random number generator.data = {'a': np.arange(50), 'c': np.random.randint(0, 50, 50), 'd': np.random.randn(50)}data['b'] = data['a'] + 10 * np.random.randn(50)data['d'] = np.abs(data['d']) * 100fig, axes = plt.subplots(2,1) # fig Have 2 That's ok 1 List subgraphs , Store in axes Array (np.array type ) in .ax = axes[0]ax.scatter('a', 'b', c='c', s='d', data=data)ax.set_xlabel('entry a')ax.set_ylabel('entry b')# Axis domain 2 , Remove the color c, shape s Parameters .ax2 = axes[1]ax2.scatter('a', 'b', data=data)plt.show() The drawing is , The second one is that s,c Image after parameter :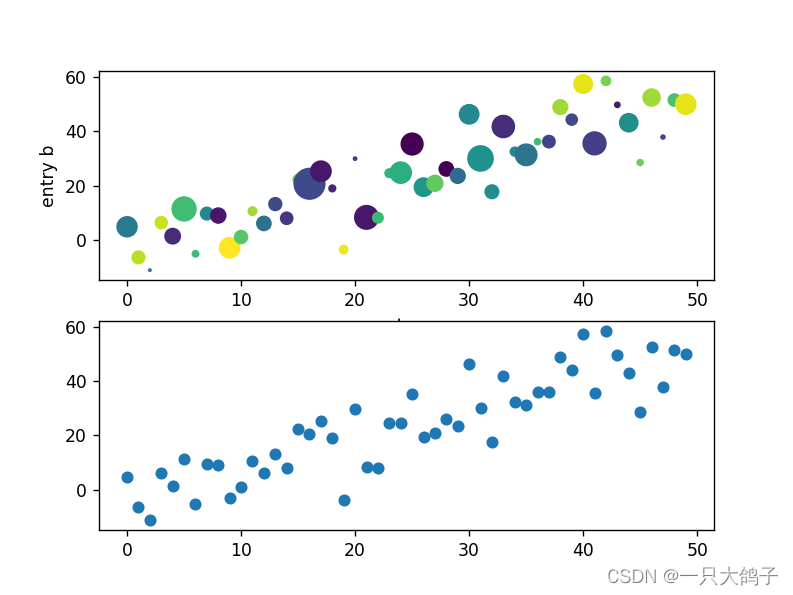
Encoding style Coding Styles
object-oriented (OO) and pyplot The function interface .
Basically, there are two uses Matplotlib Methods :
Create explicitly “ graphics (Figures)” and “ Axis domain (Axes)”, And call the method on it (“ object-oriented (OO) style ”).
rely on pyplot Automatically create and manage drawings and axes , And use pyplot Function to plot .
Use OO style ( I feel OO The style is better , Just in the axis field (Axes) Object can be set , Very clear ):
x = np.linspace(0, 2, 100) # Generate some data # Use OO style , First generate two objects Graph and axis field (fig, ax)fig, ax = plt.subplots(figsize=(5, 2.7), layout='constrained')# call ax Object method ax.plot(x, x, label='linear') # Plot some data on the axes.ax.plot(x, x**2, label='quadratic') # Plot more data on the axes...ax.plot(x, x**3, label='cubic') # ... and some more.ax.set_xlabel('x label') # Add an x-label to the axes.ax.set_ylabel('y label') # Add a y-label to the axes.ax.set_title("Simple Plot") # Add a title to the axes.ax.legend() # Add a legend.plt.show() a legend.Or use pyplot Function style :
x = np.linspace(0, 2, 100) # Sample data.plt.figure(figsize=(5, 2.7), layout='constrained')plt.plot(x, x, label='linear') # Plot some data on the (implicit) axes.plt.plot(x, x**2, label='quadratic') # etc.plt.plot(x, x**3, label='cubic')plt.xlabel('x label')plt.ylabel('y label')plt.title("Simple Plot")plt.legend();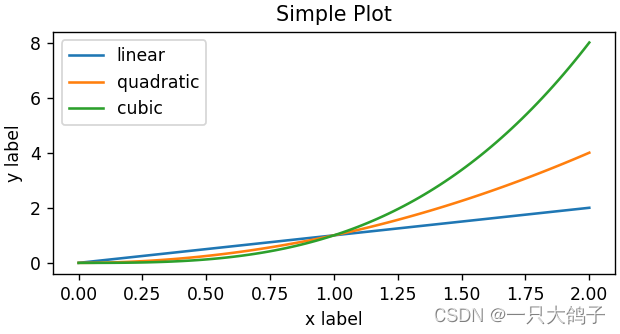
( Besides , There's a third way , Used in GUI Embed... In the application Matplotlib The situation of , Even for graphic creation . For more information , See the corresponding section in the Library : Embed Matplotlib.
Common drawing types
From the homepage of the official website Get into Plot types, You can see how to draw commonly used different types of graphs .
You can see , Common line chart 、 Scatter plot 、 Histogram, etc . Click the corresponding figure to enter the corresponding case .
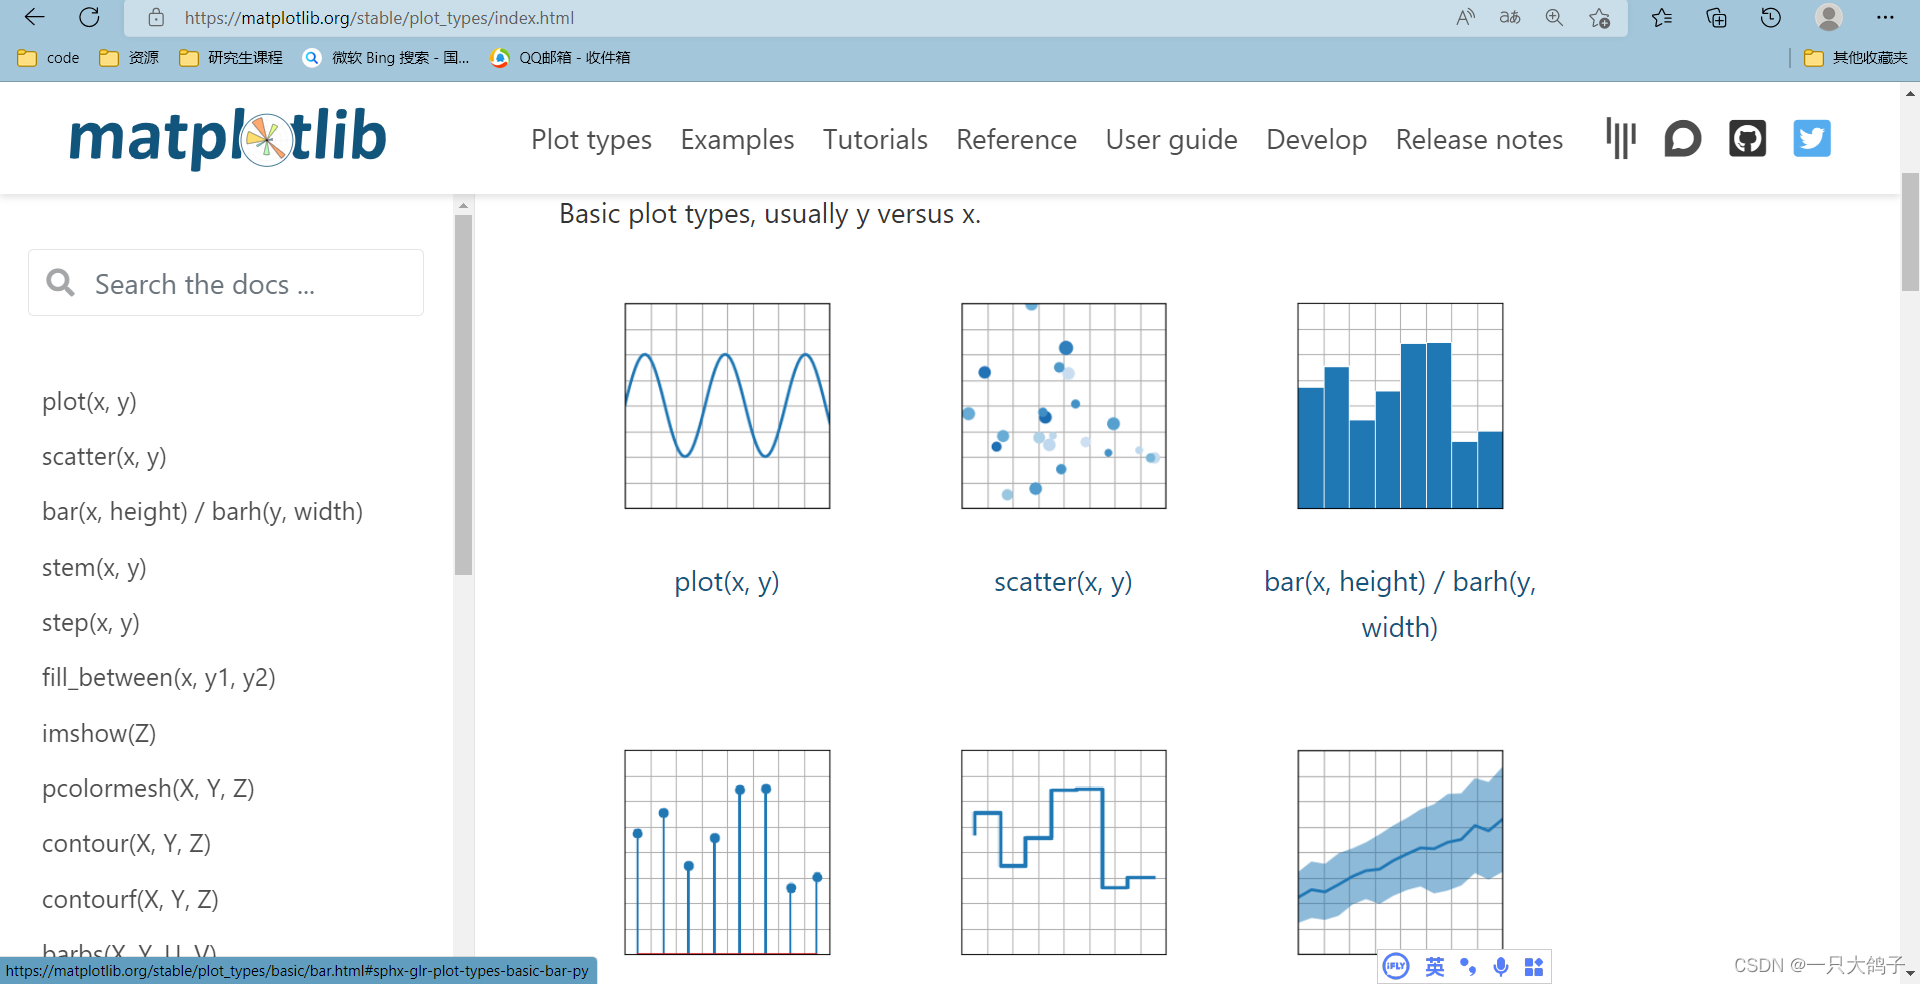
The main usage is basically like this , We'll talk about some style adjustments later .
边栏推荐
- Jenkins introduction
- Hilditch refinement (implementation I)
- [jzof] 04 search in two-dimensional array
- How do test / development programmers survive the midlife crisis? You can see it at a glance
- Summary of yarn Explorer
- findContours
- [Development Tutorial 4] open source Bluetooth heart rate waterproof sports Bracelet - external flash reading and writing
- Baidu PaddlePaddle easydl helps improve the inspection efficiency of high-altitude photovoltaic power stations by 98%
- Intel internship mentor layout problem 1
- ma.glasnost.orika. MappingException:No converter registered for conversion from Date to LocalDateTime
猜你喜欢
![[blind box app mall system] function introduction after online unpacking](/img/c9/3d13409113a3671555c4744eeb3913.jpg)
[blind box app mall system] function introduction after online unpacking

C # image template matching and marking

Big country "grain" policy | wheat expert Liu Luxiang: China's rations are absolutely safe, and the key to increasing grain potential lies in science and technology

Together again Net program hangs dead, a real case analysis of using WinDbg

01_ UE4 advanced_ PBR material

Node installation using NVM succeeded, but NPM installation failed (error while downloading, TLS handshake timeout)

Lenovo Filez helps Zhongshui North achieve safe and efficient file management
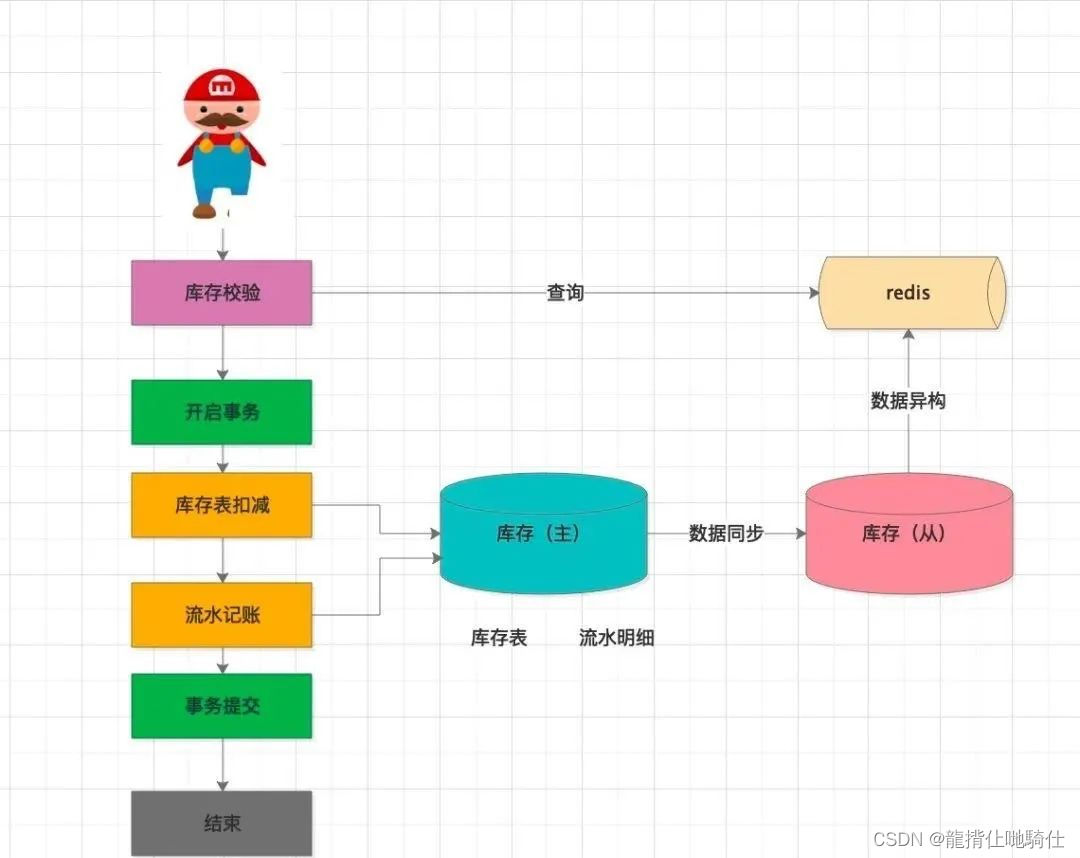
How does redis realize inventory deduction and prevent oversold? (glory Collection Edition)
![[feature construction] construction method of features](/img/5c/c240d9d742f37cbc52afecf15b2ad1.png)
[feature construction] construction method of features
![[shallow copy and deep copy], [heap and stack], [basic type and reference type]](/img/cc/d43e0046d83638f381c34b463f64a2.png)
[shallow copy and deep copy], [heap and stack], [basic type and reference type]
随机推荐
[advanced data mining technology] Introduction to advanced data mining technology
Want to open an account and fry American crude oil, but always worry about insecurity?
Go language structure
Leetcode 15. sum of three numbers
Together again Net program hangs dead, a real case analysis of using WinDbg
93. Recursive implementation of combinatorial enumeration
Leetcode skimming -- bit by bit record 018
[shallow copy and deep copy], [heap and stack], [basic type and reference type]
APR learning failure problem location and troubleshooting
Redis (12) -- redis server
You must make good use of MySQL and JSON
High soft course summary
C WinForm actual operation XML code, including the demonstration of creating, saving, querying and deleting forms
Alibaba cloud and parallel cloud launched the cloud XR platform to support the rapid landing of immersive experience applications
Solution: 2003 cant connect to MySQL server on * * * * and use near 'identified by' * * * * 'with grant option' at
How does redis realize inventory deduction and prevent oversold? (glory Collection Edition)
Information system project manager must recite the core examination site (47) project subcontract
Summary of communication with customers
How about Urumqi Shenwan Hongyuan securities account opening? Is it safe?
[Development Tutorial 4] open source Bluetooth heart rate waterproof sports Bracelet - external flash reading and writing