当前位置:网站首页>The JVM outputs GC logs, causing the JVM to get stuck. I am stupid
The JVM outputs GC logs, causing the JVM to get stuck. I am stupid
2022-06-26 14:40:00 【Dry goods full hash】

This series is I TM People are stupid Series 7 [ Over your face ], Past highlights :
- Upgrade to Spring 5.3.x after ,GC The number of times has increased sharply , I TM People are stupid :https://zhuanlan.zhihu.com/p/397042565
- This large table is queried by index fields SQL How did you complete the scan , I TM People are stupid :https://zhuanlan.zhihu.com/p/397271448
- If there is another exception in the exception information, the log cannot be found , I TM People are stupid :https://zhuanlan.zhihu.com/p/398521426
- spring-data-redis Connection leakage , I TM People are stupid :https://zhuanlan.zhihu.com/p/404912877
- Spring Cloud Gateway No link information , I TM People are stupid :https://zhuanlan.zhihu.com/p/413589417
- Spring Cloud Gateway The avalanche , I TM People are stupid :https://zhuanlan.zhihu.com/p/414705493
lately , We upgraded Java 17. later , our k8s In order to optimize our application log collection , Will we all pod ( You can understand it as a Java Microservice processes ) Of JVM All logs are collected to the same AWS Of EFS service (EFS yes Elastic File System Abbreviation , Elastic block file storage system , The bottom is NFS + S3 Object storage cluster ), We have to JVM Log configuration includes the following :
- GC journal :-Xlog:gc*=debug:file=${LOG_PATH}/gc%t.log:utctime,level,tags:filecount=50,filesize=100M
- JIT Compile log :-Xlog:jit+compilation=info:file=${LOG_PATH}/jit_compile%t.log:utctime,level,tags:filecount=10,filesize=10M
- Safepoint journal :-Xlog:safepoint=trace:file=${LOG_PATH}/safepoint%t.log:utctime,level,tags:filecount=10,filesize=10M
- Close stack omit : This will only omit JDK Internal exception , such as NullPointerException Such :-XX:-OmitStackTraceInFastThrow, Our application has optimized the performance pressure caused by outputting a large number of stacks when a large number of errors are reported , Reference resources :https://zhuanlan.zhihu.com/p/428375711
JVM Please refer to for unified log configuration :https://zhuanlan.zhihu.com/p/111886882
After that , There is such a strange problem in our application , There are three different phenomena in this problem , The expression of unity is The time at the safe point is very, very long :
1. adopt safepoint The log shows , Waiting for all threads to enter the safe point is particularly long (Reaching safepoint:25s many ) 2. adopt safepoint The log shows , And in safepoint For a long time , And the reason is GC(At safepoint: 37s many )
 see GC journal ,
Heap before GC invocations There is a long gap between the log and the output heap structure : 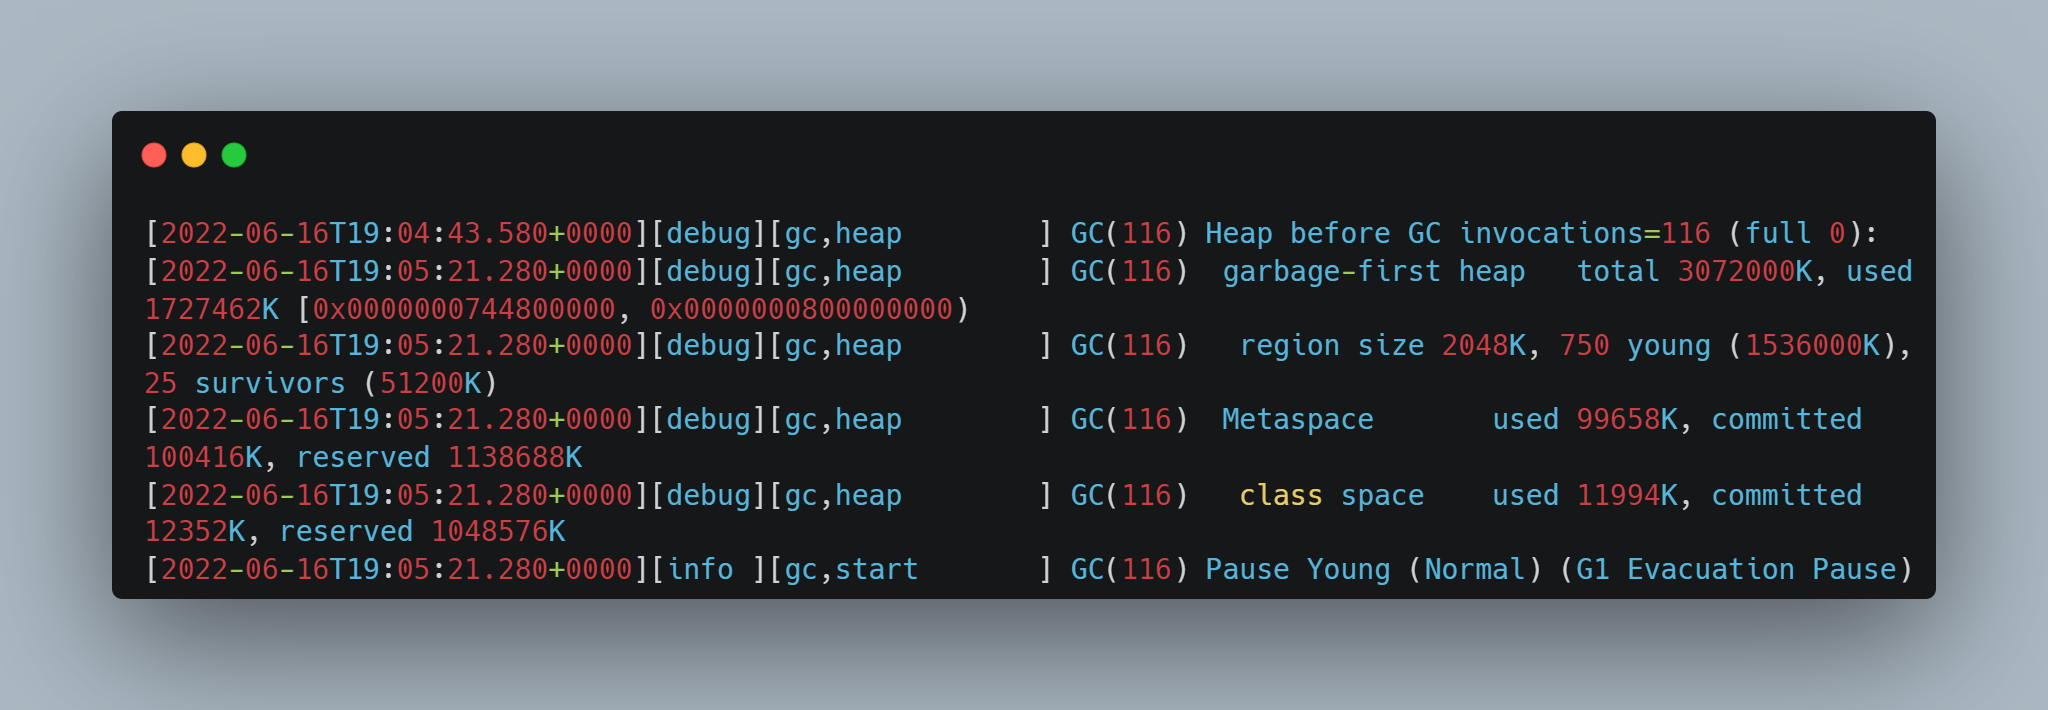 3. The other is in safepoint For a long time , The reason is GC, But the place of interval log is different (29s many ) see GC journal , Some of the logs of the output heap structure are spaced for a long time :
Problem location
First ,Java The application thread as a whole is in safepoint, At this time, the application thread can do nothing , Therefore, monitoring that depends on the application thread is through JVM External monitoring , for example spring actuator exposed prometheus Interface , as well as Skywalking Pile insertion monitoring , You can't see anything , You can only see that these methods are called for a very long time out of the safety point , But these methods don't really have a bottle .
Need to pass through JVM Monitoring mechanism of internal thread , for example JVM journal , as well as JFR(Java Flight Recording) To locate . The other is through the async_profiler (https://github.com/jvm-profiling-tools/async-profiler/), Because we found that , When something goes wrong , Of the process itself CPU Occupy ( Note that it is not a machine , It's the of this process ) And it's going to surge :

But it's very strange that , adopt async_profiler see CPU Occupy , The time period when the problem was found , except :
also While at a safe point , The log is also interrupted , This is very rare , Why do you say that? , Look at the analysis below :
For phenomenon I , Wait for all threads to enter safepoint It's been a long time , This usually outputs the log that waits for which thread does not enter the safe point , Reference resources JVM Source code :
https://github.com/openjdk/jdk/blob/master/src/hotspot/share/runtime/safepoint.cpp
But in phenomenon 1, we don't see which thread leads to entry safepoint drawn-out .
For phenomenon 2 , adopt JFR, I didn't see GC Which stage of the takes a long time :
For phenomenon 3 , By looking at JVM Source code discovery , Between the code that outputs these two logs with large intervals , Didn't do anything , Just keep a diary . And view all abnormal time points , Every hour 05 about , Ask the O & M to know at this time , The log files of the previous hour will be moved out and EFS Sync ( We generate a log file every hour ), There will be a lot of files IO( Because the underlying uses cloud services , Maybe it's not a disk , It is EFS such NFS Or network object storage ). Could it be a file IO Too much leads to JVM Log output is blocked, resulting in JVM Stuck ?
Why? JVM Log output results in JVM All application threads are stuck , hypothesis JVM A thread output log is stuck , If not in safepoint, Then it won't jam all the application threads , It will only jam itself . But if safepoint, All application threads themselves are suspended , If this time some JVM Thread output log stuck , This may cause delay in all threads entering the safe point , Or all are in a safe place for too long . Corresponding phenomenon I , A thread outputs JVM Logs instead of application logs ( The output application log usually involves files IO Native call , If you are in a native call, you will be deemed to have entered a safe point , No impact , Please refer to another article of mine :JVM relevant - SafePoint And Stop The World Full solution :https://zhuanlan.zhihu.com/p/161710652), Output JVM The log jam causes the thread to fail to enter the safe point . In view of phenomenon 23 , All are GC Thread output JVM The log is stuck, causing GC Never ending .
First, through JVM Confirm the source code JVM Whether the log output is blocked JVM.
JVM Output JVM Log source code analysis
We use Java 17,Java 17 There was no asynchronism before JVM Log output . So please ignore the asynchronous log code for the source code analysis later , This is the Java 17 Log output before :
https://github.com/openjdk/jdk/blob/master/src/hotspot/share/logging/logFileStreamOutput.cpp

You can see from the code here , If the output file IO Get stuck , there flush It will get stuck . meanwhile , There will be a short CPU a surge , Because the strategy of waiting should be CPU After idling and waiting for a period of time, it enters into blocking .
So how about we change to asynchronous logging ? What are the parameters of asynchronous logging ? JVM Asynchronous logging is Java 17 Introduced , Corresponding ISSUE yes :https://bugs.openjdk.org/browse/JDK-8229517, The key is , Lies in these two parameters :
adopt -Xlog:async Enable JVM Asynchronous log , adopt -XX:AsyncLogBufferSize= Specify the asynchronous log buffer size , The default size is 2097152 namely 2MB. The principle of asynchronous logging is :

Change the parameter to asynchronous log , The problem has been greatly alleviated , But not completely , Further positioning
We change the log to asynchronous log , Add startup parameters : -Xlog:async,-XX:AsyncLogBufferSize=4194304. Then observe , The problem has been greatly alleviated :

But there was a problem in one instance , Check the phenomenon , It is different from the previous one , adopt safepoint Read the diary , It is a thread that has been running Unwilling not to enter safepoint:

So what is this thread doing ? adopt jstack Let's see what this thread is :

This is a thread that periodically refreshes the list of micro service instances , Code for WebFlux The use of is not standard :

This uses asynchronous code , May bring JIT Optimization error ( Correct usage calls are frequent , This incorrect usage call is also very frequent , Lead to JIT C2 Continuous optimization and de optimization ), see JFR I found that there were many during this period JIT To optimize :

This may lead to the loss of safety points to IO The problem of constantly idling and waiting for a long time , Need to change to the correct usage :

After modification , Delay in entering safepoint The problem disappeared .
WeChat search “ It's full of dry goods ” Official account , Add author wechat , Once a day , Easy to upgrade technology , Capture all kinds of offer:
I will often send some good news videos of official communities with various frameworks and add personal translation subtitles to the following address ( Including the official account above. ), Welcome to your attention :
- You know :https://www.zhihu.com/people/zhxhash
- B standing :https://space.bilibili.com/31359187
边栏推荐
猜你喜欢

Chinese output of PostGIS console is garbled

Electron

Build your own PE manually from winpe of ADK

Sword finger offer 09.30 Stack

Combat readiness mathematical modeling 31 data interpolation and curve fitting 3

9 articles, 6 interdits! Le Ministère de l'éducation et le Ministère de la gestion des urgences publient et publient conjointement neuf règlements sur la gestion de la sécurité incendie dans les établ

Common evaluation indexes of classification model -- confusion matrix and ROC curve

【soloπ】adb连接单个多个手机

From Celsius to the three arrows: encrypting the domino of the ten billion giants, and drying up the epic liquidity

The annual salary of 500000 is one line, and the annual salary of 1million is another line
随机推荐
transformers DataCollatorWithPadding类
Summary of decimal point of amount and price at work and pit
Sword finger offer 40.41 Sort (medium)
Experience sharing of mathematical modeling: comparison between China and USA / reference for topic selection / common skills
Excerpt from three body
From Celsius to the three arrows: encrypting the domino of the ten billion giants, and drying up the epic liquidity
The annual salary of 500000 is one line, and the annual salary of 1million is another line
C language | Consortium
Why is there always a space (63 or 2048 sectors) in front of the first partition when partitioning a disk
网上股票开户安不安全?谁给回答一下
印尼投资部长:鸿海考虑在其新首都建立电动公交系统、城市物联网
MHA high availability coordination and failover
How to mount cloud disks in ECS
人的顶级能量从哪里获取?
Atcoder bit operation & Conclusion + formula derivation
【soloπ】adb连接单个多个手机
C语言基础知识入门(大全)「建议收藏」
MySQL master-slave replication and read-write separation
C | analysis of malloc implementation
'coach, I want to play basketball!'—— AI Learning Series booklet for system students