当前位置:网站首页>Common evaluation indexes of classification model -- confusion matrix and ROC curve
Common evaluation indexes of classification model -- confusion matrix and ROC curve
2022-06-26 14:22:00 【Chaoying.】
Confusion matrix

Quantitative accuracy
- Overall classification accuracy (Overall Accuracy)
The number of samples with correct classification / The total number of samples
OA=(e+f+g)/(a+b+c+d+e+f+g+h+i) - Kappa coefficient
P0=OA
Pe=∑( Real sample number × Number of classified samples )/ The total number of samples 2
for example :Pe=[(a+b+c)×(a+d+g)+(b+e+h)×(d+e+f)+(g+h+i)×(c+f+i)] /(a+b+c+d+e+f+g+h+i)2
Kappa=(P0-Pe )/(1-Pe) - User accuracy (User accuracy )
From the perspective of prediction , The number of correctly predicted samples accounts for the total number of predicted samples in this category- Category 1user_accuracy=a/(a+d+g)
- Category 2user_accuracy=e/(b+e+h)
- Category 3user_accuracy=i/(c+f+i)
- Producer’s accuracy (Producer accuracy)
From the perspective of samples , The number of correctly predicted samples accounts for the total number of samples in this category- Category 1Prod.accuracy=a/(a+b+c)
- Category 2Prod.accuracy=e/(d+e+f)
- Category 3Prod.accuracy=i/(g+h+i)
ROC curve
roc The curve is mainly used to evaluate the accuracy of the binary classification model 
a:TP( True positive )
c:FP( False positive )
b:FN( False positive )
d:TN( True negative )
- True inspection rate ( sensitivity , Hit rate )
TPR=a/(a+b) - False detection rate ( Specificity , False alarm rate )
FPR=c/(c+d)
ROC curve The horizontal axis of the coordinate is FPR, The vertical axis of the coordinate is TPR,ROC The curve does not describe FPR And TPR The functional relationship between 
ROC The curve does not describe FPR And TPR The functional relationship between ,FPR And TPR There is no functional relationship between ,FPR And TPR yes threshold τ Function of ,τ Describes the percentage of samples tested positive , When τ=0 when , All samples were identified as negative , here FPR( Specificity 、 False alarm rate 、 False detection rate ) by 0(FPR The smaller the better. ), but TPR( sensitivity 、 shooting 、 True inspection rate ) by 0(TPR The bigger the better ), When τ=1 All samples were identified as positive , here TPR=1,FPR=1. Therefore, it is necessary to select an appropriate τ Value makes TPR The bigger the better ,FPR The smaller the better. .
Area under curve (Area Under Curve,AUC)
AUC be equal to roc The area of the Encircled City along the horizontal axis of the curve and coordinate , yes roc Integral of the curve ,AUC The larger the number, the better
边栏推荐
- Installation and uninstallation of MySQL software for windows
- New specification of risc-v chip architecture
- Bucket of P (segment tree + linear basis)
- Svn commit error after deleting files locally
- Exercises under insect STL string
- Gee - Global Human Settlements grid data 1975-1990-2000-2014
- Sword finger offer 15.65.56 I 56Ⅱ. Bit operation (simple - medium)
- [cqoi2015] task query system
- Practice with the topic of bit operation force deduction
- Pointer
猜你喜欢

永远不要使用Redis过期监听实现定时任务!

Sword finger offer 09.30 Stack

Generation and rendering of VTK cylinder

Server create virtual environment run code

量化框架backtrader之一文读懂observer观测器

Practice with the topic of bit operation force deduction

Pycharm远程连接服务器来跑代码
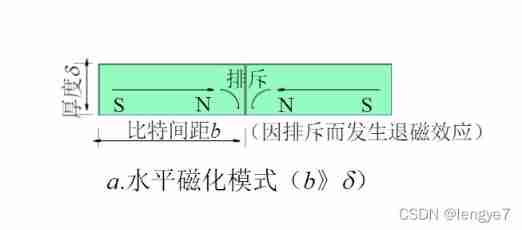
Hard (magnetic) disk (I)

7.Consul服务注册与发现
Self created notes (unique in the whole network, continuously updated)
随机推荐
Sword finger offer 06.24.35 Linked list
7.consul service registration and discovery
Difference between classification and regression
d检查类型是指针
Gartner 2022 Top Strategic Technology Trends Report
Introduction to granular computing
Original code, inverse code and complement code
Common controls and custom controls
A must for programmers, an artifact utools that can improve your work efficiency n times
Installation tutorial about origin2019
Generation and rendering of VTK cylinder
Online bull Blogger
[sdoi2013] forest
Sword finger offer 09.30 Stack
Pytorch based generation countermeasure Network Practice (7) -- using pytorch to build SGAN (semi supervised GaN) to generate handwritten digits and classify them
Pychar remotely connects to the server to run code
Codeforces Global Round 21A~D
Bucket of P (segment tree + linear basis)
Intellij IDEA--格式化SQL文件的方法
Sword finger offer 15.65.56 I 56Ⅱ. Bit operation (simple - medium)