当前位置:网站首页>JMeter use case
JMeter use case
2022-06-22 16:56:00 【MarshalEagle】
2) The purpose of the test is that the website achieves 20 QPS Response time of .
QPS explain
QPS : Query Per Second Query rate per second . Is a query The server Number of queries that can be processed per second . On the Internet , As a domain name system The server The performance of our machines is often measured by the query rate per second .
In order to achieve the desired test purpose , Need to be in jmeter Create a test plan in . Because this test only requires the completion of fnng.cnblogs.com and tt-topia.rhcloud.com Two blog home page requests , So just use HTTP Request Sampler that will do .
Establish test plan
start-up jmeter after ,jmeter An empty test plan will be automatically generated , Users can create their own test plan based on the test plan .
Add thread group
One Performance testing The request load is based on a thread group . A test plan must have a thread group . Adding thread groups to test plans is very simple . Right click on the test plan to pop up the drop-down menu ( add to -->Threads(Users)---> Thread group ) Select the thread group in the .
jmeter in Each test plan needs to contain at least one thread group , Of course, you can also create multiple thread groups in one plan , How will the multiple thread groups execute in sequence ( Serial or parallel )? Under the test plan, multiple threads are executed in parallel , In other words, these thread groups are initialized and executed at the same time Sampler Of .


Thread group mainly contains three parameters : Number of threads 、 Long preparation time (Ramp-Up Period(in seconds))、 cycles .
Number of threads : Number of virtual users . A virtual user occupies a process or thread . How many virtual users are set here is how many threads are set .
Long preparation time : How long does it take to set the number of virtual users to start all . If the number of threads is 20 , The preparation time is 10 , You need to 10 Seconds start 20 Threads . It starts every second 2 Threads .
cycles : The number of times each thread sends a request . If the number of threads is 20 , The number of cycles is 100 , So each thread sends 100 Requests . The total number of requests is 20*100=2000 . If I check that “ forever ”, Then all the threads will keep sending requests , Once you choose to stop the script .
Setting a reasonable number of threads has a decisive impact on whether the test goal can be achieved . In this case , Ask to get the homepage of the website in 20 QPS Response time under load , If the number of threads is set too small , It is very likely that the set QPS requirement . in addition , It is also important to set a reasonable number of cycles , In addition to the fixed number of cycles and forever described above ; You can also flexibly select and set the test run time . Check “ Scheduler ”, Configure the scheduler .
add to HTTP request
After adding thread groups , Right click menu on thread group ( add to --->Sampler--->HTTP request ) choice HTTP request . about jmeter Come on , Sampler (Sampler) Is the unit that interacts with the server . A sampler usually works in three parts :
Send request to server
Record the response data of the server
Record the corresponding time information


One HTTP Requests have many configuration parameters , More on this below :
name : This property is used to identify a sampler , A meaningful name is recommended .
notes : It doesn't work for testing , Only users record user readable annotation information .
Server name or IP :HTTP The name of the target server or IP Address .
Port number : The port number of the target server , The default value is 80 .
agreement : Send to the target server HTTP Protocol at request time , It can be http Or is it https , The default value is http .
Method : send out HTTP Requested method , Available methods include GET、POST、HEAD、PUT、OPTIONS、TRACE、DELETE etc. .
Content encoding : How the content is encoded , The default value is iso8859
route : The goal is URL route ( Server address and port are not included )
Automatic redirection : If this option is selected , When sending HTTP The response is 302/301 when ,JMeter Automatically redirect to a new page .
Use keep Alive : When this option is selected ,jmeter And the target server Keep-Alive In a way that HTTP signal communication , Selected by default .
Use multipart/from-data for HTTP POST : When sending HTTP POST When asked , Use Use multipart/from-data Method to send , Not selected by default .
Send the parameters with the request : Sent in the request URL Parameters , For... With parameters URL ,jmeter Provides a simple way to parameterize . Users can URL All parameters in are set in this table , Each row in the table is a parameter value pair ( Corresponding RUL Medium name 1= value 1).
Send the file with the request : Send the file in the request , Usually ,HTTP File upload behavior can be simulated in this way .
from HTML The file gets all the included resources : When this option is selected ,jmeter In a HTTP Requesting and receiving a response HTML After file contents , Also on the HTML Conduct Parse And get the HTML All the resources contained in ( picture 、flash etc. ), Not selected by default , If the user only wants to get specific resources in the page , It could be down here Embedded URLs must match Fill in the text box with the required download Resource specific expression for , such , Only those that match the specified regular expression URL Pointing to resources will be download .
Used as a monitor : This sampler is used as a monitor , stay Monitor Results Listener You can directly see the graphical statistical information based on the sampler . The default is not selected .
Save response as MD5 hash? : Select the , Only the server-side response data is recorded at execution time MD5 value , Without recording the complete response data . When a very large amount of data needs to be tested , It is recommended that this item be selected to reduce the overhead of the sampler recording response data .
Here we add two HTTP request , Respectively for fnng.cnblogs.com and tt-topia.rhcloud.com Send a request .
Set up QPS Limit
The purpose of the test mentioned in the requirements of this performance test is “ Understand that the front page of the blog is loaded to 20 QPS Response time of ”, Therefore, it is necessary to control the load of sending requests to the blog home page as 20QPS.
One possible approach is to gradually adjust the number of threads in the test plan and the number of threads for the sampler (Sampler) Add timers (Timer), In order to make HTTP Request from sampler QPS Stay in 20 about . But this method is time-consuming and labor-intensive , It takes many attempts to achieve ; Another way , It is completely controlled by setting the timer QPS, Once the response time of the sampler changes ( The network environment has changed ), It is necessary to readjust the waiting time of the timer .
Jmeter Provides a very useful timer , be called Constant Throughput Timer ( Constant throughput timer ), The timer can easily control the throughput of a given sampler .
Right click on the fnng.cnblogs.com , Pop up menu ( add to ---> Timer --->Constant Throughput Timer) choice Constant Throughput Timer


Constant Throughput Timer The main properties of :
name : The name of the timer
Target throughput(in samples per minute): Target throughput . Note that here is the number of requests sent per minute , therefore , Corresponding to the requirements of test requirements 20 QPS , The value here should be 1200 .
Calculate Throughput based on : Yes 5 An option , Namely :
This thread only : Control the throughput of each thread , When choosing this mode , The total throughput is set to target Throughput Times the number of threads .
All active threads : Set up target Throughput Will be allocated on each active thread , Each active thread waits a reasonable amount of time after the last run and then runs again . An active thread is a thread that runs at the same time .
All active threads in current thread group : Set up target Throughput Will be assigned to each active thread in the current thread group , When there is only one thread group in the test plan , The option and All active threads The effect of the options is exactly the same .
All active threads (shared ): And All active threads The options are basically the same , The only difference is , Each active thread will wait a reasonable time after the last run of all active threads and run again .
All cative threads in current thread group (shared ): And All active threads in current thread group Basically the same , The only difference is , Each active thread will wait a reasonable time after the last run of all active threads and run again .
Pictured above , This element acts only on fnng.cnblogs.com , Set the timer Target throughput by 1200/ minute (20 QPS), Set up Calculate Throughput based on The value of is All active threads .
Of course ,Constant Throughput Timer Only threads in a thread group produce enough request It makes sense when it's not , therefore , Even if it's set Constant Throughput Timer Value , It may also be due to the insufficient number of threads in the thread group , Or the timer setting is unreasonable and other reasons lead to the overall QPS Can't achieve the expected goal .
Add listener (Listener)
After the main part of the script is set up , We need to get the test results in the performance test in some way , In this case , What we care about is the response time of the request .
Jmeter The listener element is used to collect the data recorded by the sampler and present it in a visual way .Jmeter There are different types of listeners , Because on HTTP request , We can add aggregate reports in , More intuitive view of test results .
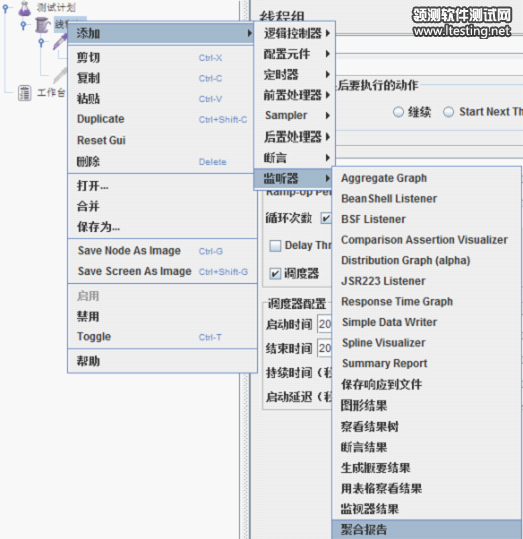
Add aggregation report , Right click on thread group , On the menu ( add to ---> Monitor ---> Aggregation report ) Select aggregate report from the .
Run script
After adding the aggregation report , Let's run the script , The parameters of the aggregation report are described later .
Before running the script , Let's take a look at , Parameter setting of each component :
---------------------------------------------------------------
Thread group :
Number of threads :20
Long preparation time : 10
cycles :10
---------------------------------------------------------------
HTTP request :
name :fnng.cnblogs.com.
Server name or IP :fnng.cnblogs.com
Port number :80
Implementation : java
agreement : http
Method : GET
route :/
---------------------------------------------------------------
Constant throughput timer :
Target throughput(in samples per minute):1200.0
Calculate Throughput based on :All active threads
---------------------------------------------------------------
Click the run button on the toolbar , Or click on the menu bar “ function ---> start-up ” Or use shortcut keys ctrl+r To run the program .
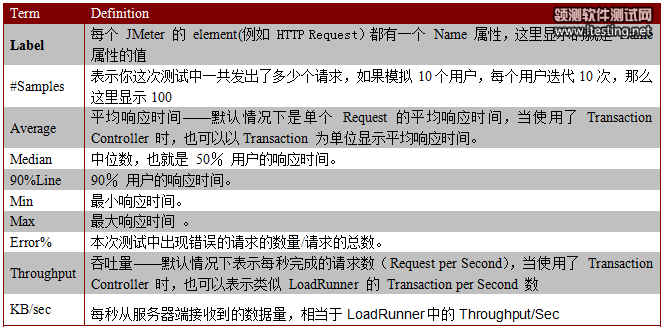
Aggregate report analysis
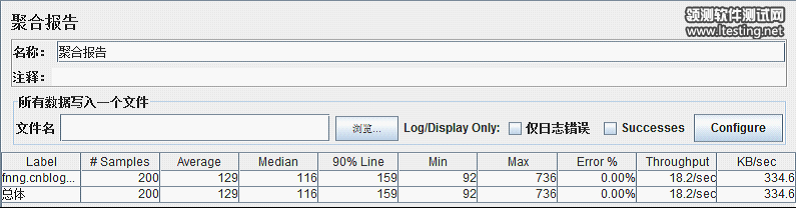
View the running results of the aggregate report :
边栏推荐
猜你喜欢


随机推荐
[wechat applet custom bottom tabbar]
Summary of safari compatibility issues
Spark性能调优之道——解决Spark数据倾斜(Data Skew)的N种姿势
毕业季·本科毕业感想——机械er的自救之路
MYSQL 存储过程异常处理 报错 错误代码: 1337
Purchase guide - how to purchase a high-quality conference tablet, these aspects must be compared
5 modes of IO model
Consumption monitoring of Prometheus monitoring [consult exporter]
hydra安装及使用
什么是RESTful,REST api设计时应该遵守什么样的规则?
Spark Streaming checkpoint的问题与恢复
Call CMD process communication
jMeter使用案例
SAP value process & help request process-011
win10的wifi断线后无法连接
招行23型号UKey在win7上无法识别
数据库mysql 主从方案
【C语言】深度剖析指针和数组的关系
超出文本部分用省略号表示
变量