当前位置:网站首页>scikit-learn笔记
scikit-learn笔记
2022-07-24 05:15:00 【我爱学习653】
1.过拟台和灾拟合
%matplotlib inline
import matplotlib.pyplot as plt
import numpy as np

# 设置所需要的点数
n_dots = 20

# x轴的坐标
# [0, 1] 之间创建 20 个点
x = np.linspace(0, 1, n_dots)
# y轴坐标:训练样本
y = np.sqrt(x) + 0.2*np.random.rand(n_dots) - 0.1;
def plot_polynomial_fit(x, y, order):
    p = np.poly1d(np.polyfit(x, y, order))

    # 画出拟合出来的多项式所表达的曲线以及原始的点
    t = np.linspace(0, 1, 200)
    # 设置虚线和实线分别表示的模型
    plt.plot(x, y, 'ro', t, p(t), '-', t, np.sqrt(t), 'r--')
    return p
# figsize:指定figure的宽和高,单位为英寸;
plt.figure(figsize=(18, 4))
titles = ['Under Fitting', 'Fitting', 'Over Fitting']
models = [None, None, None]
for index, order in enumerate([1, 3, 10]):
    # 创建多个子图(此处为三个)
    plt.subplot(1, 3, index + 1)
    models[index] = plot_polynomial_fit(x, y, order)
    # 设置图像的标题
    plt.title(titles[index], fontsize=20)
2.成本函数
3.模型准确性
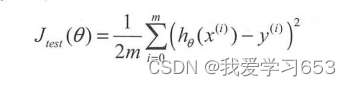
在scikit-leam 里,不使用成本函数来表达模型的性能,而使用分数来表达,这个分数总是在【0,1】间, 数值越大说明模型的准确性越好。
模型分数(准确性〉与成本成反比 即分数越大,准确性越高,误差越小,成本越低 反之,分数越小,准确性越低,误 越大,成本越高。
2交叉验证数据集
把数据集分成 份, 分别是训练数据集 交叉验证数据集测试数据集,推荐比例是6 : 2 : 2。
我们把数据集分成训练数据集和测试数据集。在模型选择时,我们使用训练数据集来训练算法参数,用 交叉验证数据集来验证参数。选择交叉验证数据集的成本 J 最小的多项式来作为数据拟合模型,最后再用测试数据集来测试选择出来的模型针对测试数据集的准确性。
4.学习曲线
%matplotlib inline
import matplotlib.pyplot as plt
import numpy as np
n_dots = 200

X = np.linspace(0, 1, n_dots)
y = np.sqrt(X) + 0.2*np.random.rand(n_dots) - 0.1;

X = X.reshape(-1, 1)
y = y.reshape(-1, 1)
from sklearn.pipeline import Pipeline#流水线
from sklearn.preprocessing import PolynomialFeatures
from sklearn.linear_model import LinearRegression

def polynomial_model(degree=1):#阶数
    polynomial_features = PolynomialFeatures(degree=degree,
                                             include_bias=False)
    linear_regression = LinearRegression()
#     先增加多项式阶数,然后再用线性回归算法来拟合数据
    pipeline = Pipeline([("polynomial_features", polynomial_features),
                         ("linear_regression", linear_regression)])
    return pipeline
from sklearn.model_selection import learning_curve
from sklearn.model_selection import ShuffleSplit

def plot_learning_curve(estimator, title, X, y, ylim=None, cv=None,
                        n_jobs=1, train_sizes=np.linspace(.1, 1.0, 5)):
    plt.title(title)
    if ylim is not None:
        plt.ylim(*ylim)
    plt.xlabel("Training examples")
    plt.ylabel("Score")
    train_sizes, train_scores, test_scores = learning_curve(
        estimator, X, y, cv=cv, n_jobs=n_jobs, train_sizes=train_sizes)
    train_scores_mean = np.mean(train_scores, axis=1)
    train_scores_std = np.std(train_scores, axis=1)
    test_scores_mean = np.mean(test_scores, axis=1)
    test_scores_std = np.std(test_scores, axis=1)
    plt.grid()

    plt.fill_between(train_sizes, train_scores_mean - train_scores_std,
                     train_scores_mean + train_scores_std, alpha=0.1,
                     color="r")
    plt.fill_between(train_sizes, test_scores_mean - test_scores_std,
                     test_scores_mean + test_scores_std, alpha=0.1, color="g")
    plt.plot(train_sizes, train_scores_mean, 'o--', color="r",
             label="Training score")
    plt.plot(train_sizes, test_scores_mean, 'o-', color="g",
             label="Cross-validation score")

    plt.legend(loc="best")
    return plt

# 为了让学习曲线更平滑,交叉验证数据集的得分计算 10 次,每次都重新选中 20% 的数据计算一遍
cv = ShuffleSplit(n_splits=10, test_size=0.2, random_state=0)
titles = ['Learning Curves (Under Fitting)',
          'Learning Curves',
          'Learning Curves (Over Fitting)']
degrees = [1, 3, 10]

plt.figure(figsize=(18, 4))
for i in range(len(degrees)):
    plt.subplot(1, 3, i + 1)
    plot_learning_curve(polynomial_model(degrees[i]), titles[i], X, y, ylim=(0.75, 1.01), cv=cv)

plt.show()
5.算法模型性能优化
如果是过拟合,可以采取的措施如下:
1)获取更多的训练、数据:
2)减少输入的特征数量:
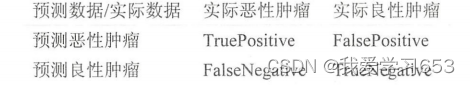
6.查准率和召回率
有时候,模型准确性并不能评价一个算法的好坏。我们引入了另外两个概念,查准率 (Precision )和召 率(Recall 。还是 以癌症筛查为例:

7.F1 Score

边栏推荐
- Markov random field: definition, properties, maximum a posteriori probability problem, energy minimization problem
- Accuracy of% connections. Now it is planned to meet the demand. The number of enterprises is enough
- Jersey2.25.1集成freemarker
- Theoretical basis of machine learning
- 太空可再生能源的代币化
- [advanced mathematics] the difference between differentiable and differentiable functions
- Performance test process
- Bear market bottoming Guide
- Memorandum 2022
- 一文带你深入浅出C字符串函数和内存函数
猜你喜欢
【深度学习】(三)图像分类

I'm interested in reading efficient reading - the most cost-effective self investment

Tips for using the built-in variable props of BeanShell

智能指针、左值引用右值引用、lambda表达式

MySQL深入了解
Using a* heuristic search to solve maze routing problem

JSP+Dao整合

FRP intranet penetration service usage

Blue Bridge Cup 31 day sprint 21 day (C language)

View progress!!! RPM installation!!!
随机推荐
Jetson device failed to download repository information use tips to record
Accuracy of% connections. Now it is planned to meet the demand. The number of enterprises is enough
Installation and login login
【NumPy】
PXE efficient batch network installation
MySQL连接
Image to image translation with conditional advantageous networks paper notes
Pointer learning diary (IV) use structure and pointer (linked list)
手写orm框架
7. Find the sum of numbers between 100 and 300 that can be divided by 3.
太空可再生能源的代币化
frp内网穿透服务使用
Use of fiddler packet capturing tool
MySQL transaction and its problems and isolation level
Hanoi problem
un7.23:如何在linix上安装MySQL?
连接数%的准确率。现在拟需求。企业在数足以
熊市抄底指南
[advanced mathematics] the difference between differentiable and differentiable functions
Execution sequence of finally and return