当前位置:网站首页>Alibaba cloud full link data governance
Alibaba cloud full link data governance
2022-06-24 07:40:00 【Concise programming】
The whole process of Alibaba cloud full link data governance experiment
- The whole process of Alibaba cloud full link data governance experiment
- Experimental address
- Experimental process
- adopt DataWorks Collect log data to MaxCompute
- adopt DataWorks Calculate and analyze the collected data
- Monitoring data quality 、 Set the quality monitoring rules and monitoring reminders of the table
- adopt Quick BI Create a dashboard for user analysis portraits of a website , Implement data table rpt_user_info_d Visualization
- Copy the following address , stay Chromium The web browser opens a new tab , Paste and access Quick BI Console .
- On the data source page , Click new data source... In the upper right .
- Convert the dimension type of the field
- Convert the dimension type of geographic information field ( Ignore )
- Save the data set
- Make a dashboard .
- The result is shown in Fig.
The whole process of Alibaba cloud full link data governance experiment
Experimental address
Experimental process
Time :20220622
adopt DataWorks Collect log data to MaxCompute
explain : This scenario has provided you with OSS Data sources and RDS data source .
newly build OSS data source .
Double click to open the virtual desktop Chromium Web browser .
stay RAM Click next... In the user login box , Copy and paste the sub-user password in the upper left corner of the page into the user password input box , Click login .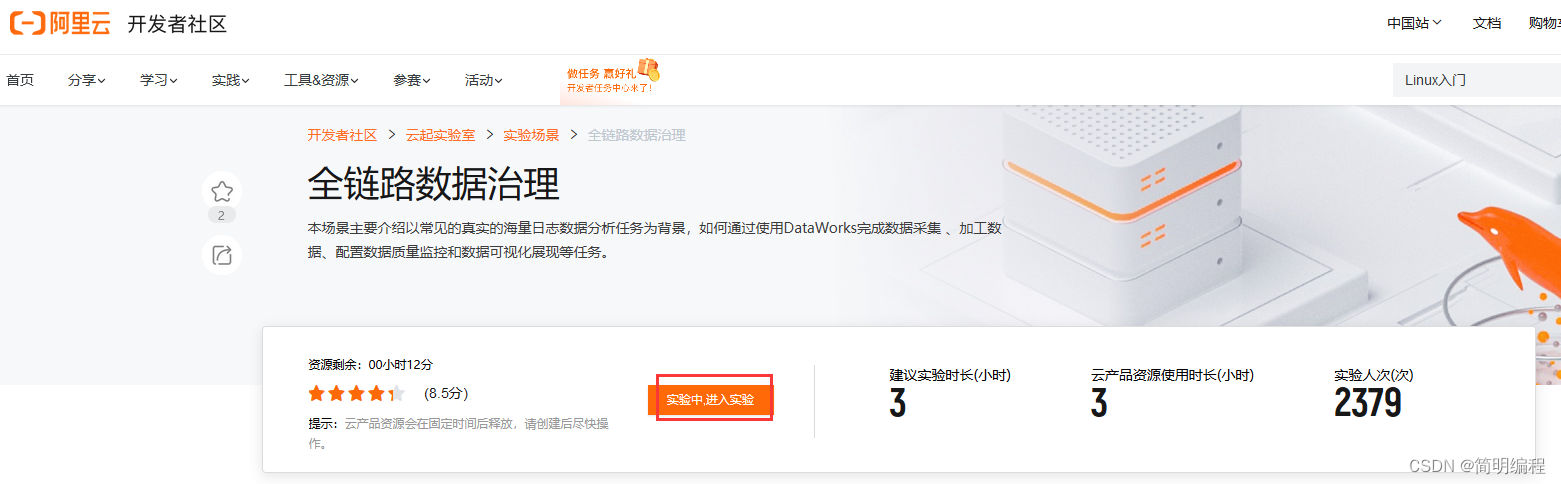

Copy the address below , stay Chromium The web browser opens a new tab , Paste and access DataWorks Console .
https://workbench.data.aliyun.com/

explain : If you visit DataWorks At the console , The big data basic service instructions page appears , Please refresh the web page .
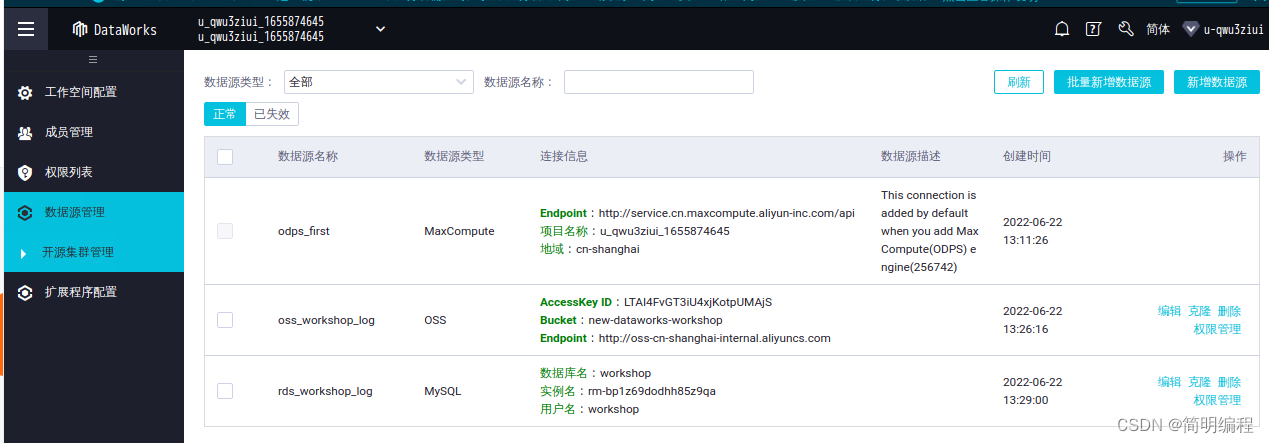
On the overview page , Find the area where your resources are located , Find your workspace , Then click data integration .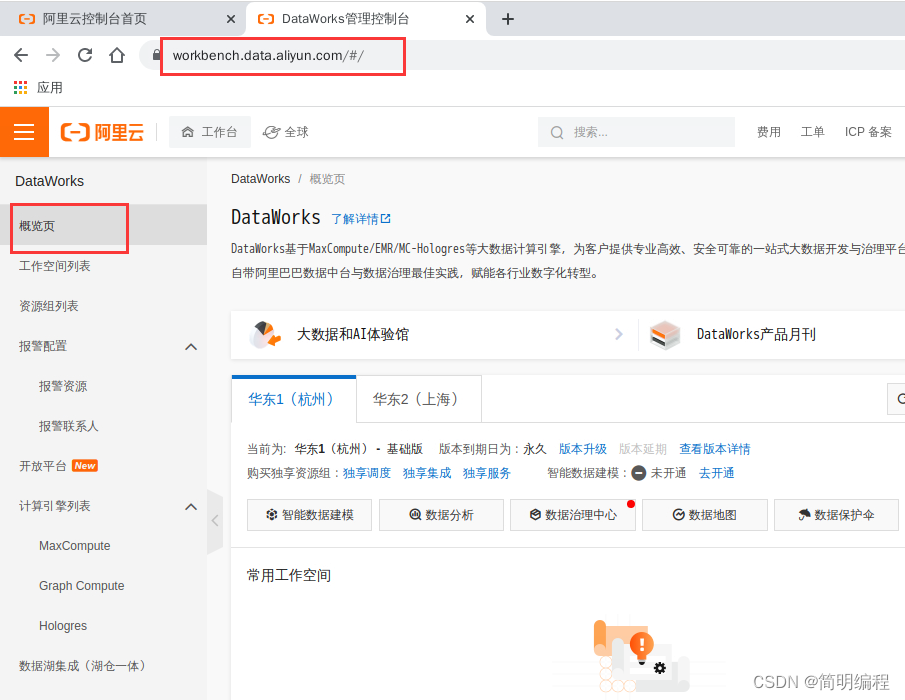

In the left navigation bar , Click data source .

On the data source management page , Click new data source at the top right .
In the new data source dialog box , Select the data source type as OSS.
In addition OSS In the data source dialog box , Configure various parameters , Click more options .
Parameter description :
 Data source name : Input oss_workshop_log.
    Endpoint: Input http://oss-cn-shanghai-internal.aliyuncs.com.
    Bucket: Input new-dataworks-workshop.
    AccessKey ID: Input LTAI4FvGT3iU4xjKotpUMAjS.
    AccessKey Secret: Input 9RSUoRmNxpRC9EhC4m9PjuG7Jzy7px.


In the resource group list , Click test connectivity... After the common resource group .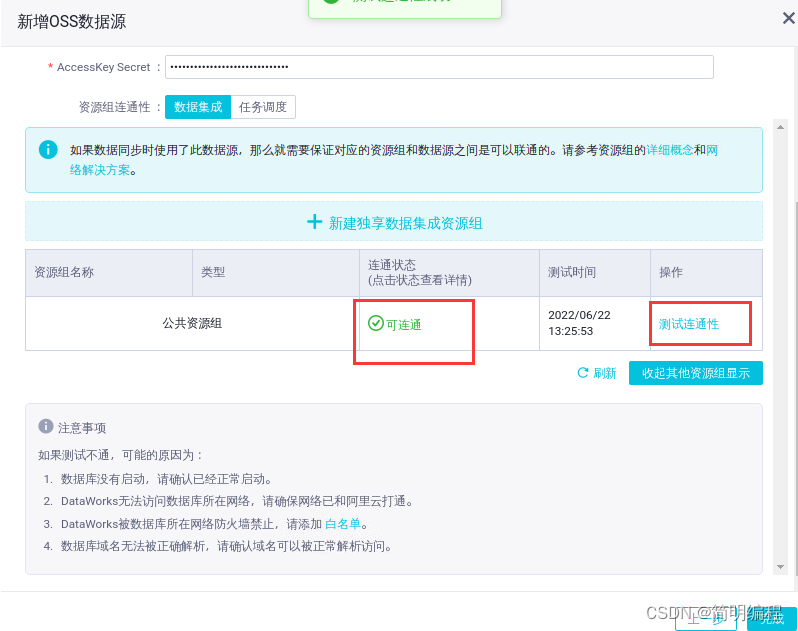
In addition OSS In the data source dialog box , Click finish .
In the new data source dialog box , Select the data source type as MySQL
In addition MySQL In the data source dialog box , Configure various parameters , Click more options .
Parameter description :
 Data source type : Select alicloud instance mode .
     Data source name : Input rds_workshop_log.
     regional : Choose East China 2( Shanghai ).
    RDS example ID: Input rm-bp1z69dodhh85z9qa.
    RDS Instance master account ID: Input 1156529087455811.
     Database name : Input workshop.
     user name : Input workshop.
     password : Input workshop#2017.


In addition MySQL In the data source dialog box , Click finish
Create business processes
On the data source management page , Click... On the top left Icon , single click DataStudio( Data development ).
On the data development page , Right click the business process , Select new business process 
In the new business process dialog box , Enter the business name , for example test, Click New .
In the business process development panel , Click the virtual node and drag it to the edit page on the right 
In the new node dialog , The node name is entered as workshop_start, Click Submit .
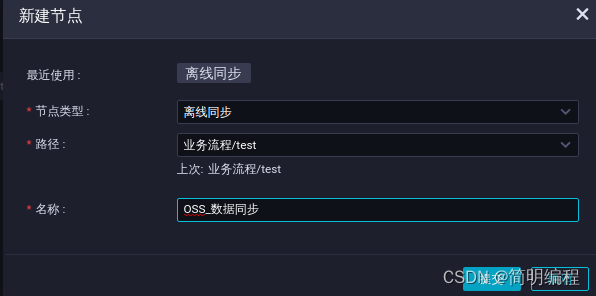
In the business process development panel , Click offline sync and drag to the edit page on the right .
In the new node dialog , The node name is entered as OSS_ Data synchronization , Click Submit .
explain : Because the virtual desktop in the current experimental environment does not support copying and pasting Chinese directly ( There will be garbled code when copying and pasting ), You can click... In the lower right corner of the virtual desktop Icon to switch the input method of the virtual desktop , Enter Chinese manually .
In the business process development panel , Click offline sync and drag to the edit page on the right .
In the new node dialog , The node name is entered as rds_ Data synchronization , Click Submit .
explain : Because the virtual desktop in the current experimental environment does not support copying and pasting Chinese directly ( There will be garbled code when copying and pasting ), You can click... In the lower right corner of the virtual desktop Icon to switch the input method of the virtual desktop , Enter Chinese manually

On the right side of the edit page , By dragging and dropping the connection , take workshop_start The node is set as the upstream node of two offline synchronization nodes 

To configure workshop_start node
On the left side of the data development page , Select the business process > Your business processes > Universal , Double click the virtual node workshop_start.

On the edit page of this node , Click scheduling configuration on the right
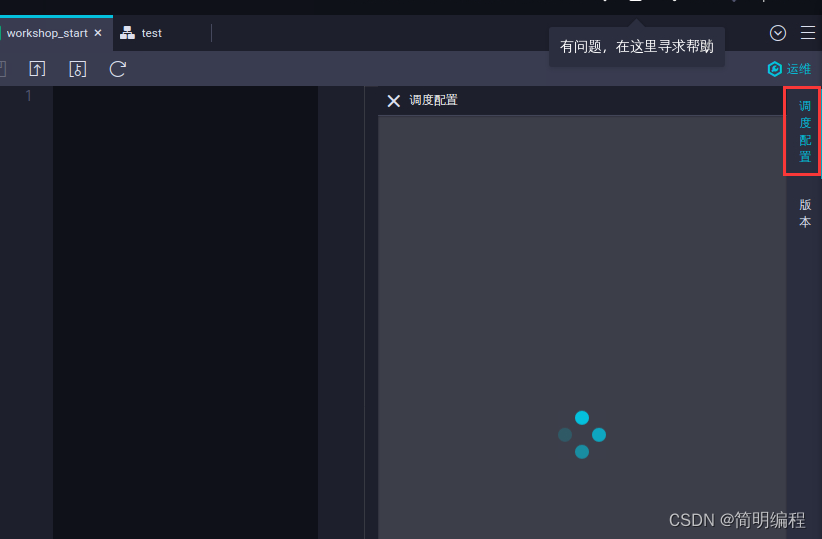
In the time attribute area of the scheduling configuration panel , The rerun attribute can be selected as rerun after successful or failed operation . In the scheduling dependency area of the scheduling configuration panel , Click Use workspace root node , Set up workshop_start The upstream node of the node is the workspace root node .
explain :
 Because the new version sets input and output nodes for each node , So we need to give workshop_start The node sets an input . Set its upstream node as the workspace root node , Usually named the workspace name _root.
 Due to the display problem of the virtual desktop browser in the current experimental environment , If the parameters on the current scheduling configuration page are misaligned , You can set the display percentage of the browser to be smaller .


At the top left of the editing page of this node , single click Icon to save the configuration .

new table
On the data development page , Select the business process >MaxCompute, Right click the table , Click new table .

In the new table dialog box , Table name input ods_raw_log_d, Click New .
In the table ods_raw_log_d Edit page for , single click DDL Pattern .
stay DDL Mode dialog , Enter the following to create OSS The log corresponds to the table creation statement of the target table , Click generate table structure .
CREATE TABLE IF NOT EXISTS  ods_raw_log_d (
    col STRING
)
PARTITIONED BY (
    dt STRING
);

In the table ods_raw_log_d Edit page for , The Chinese name is entered as OSS The log corresponds to the target table , Click submit to production .
On the data development page , Select the business process >MaxCompute, Right click the table , Click new table .
In the new table dialog box , Table name input ods_user_info_d, Click Submit .

In the table ods_user_info_d Edit page for , single click DDL Pattern .
stay DDL Mode dialog , Enter the following to create RDS Create a table statement corresponding to the target table , Click generate table structure .
CREATE TABLE IF NOT  EXISTS ods_user_info_d (
    uid STRING COMMENT 'uid',
    gender STRING COMMENT 'gender',
    age_range STRING COMMENT 'age_range',
    zodiac STRING COMMENT 'zodiac'
)
PARTITIONED BY (
    dt STRING
);

In the table ods_user_info_d Edit page for , The Chinese name is entered as RDS Corresponding to the target table , Click submit to production .

Configure the offline synchronization node .
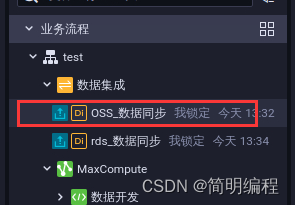
On the left side of the data development page , Select the business process > Your business processes > Data integration , double-click oss_di( In the figure below oss_ Data synchronization ).
stay oss_di The data source of the page , Configure the following parameters , Other configurations remain default .
Parameter description :
 data source : choice OSS>oss_workshop_log data source .
     file name ( Including path ): Input user_log.txt.
     file type : choice text type .
     Column separator : The input column separator is |.

stay oss_di The data destination of the page , Configure the following parameters , Other configurations are saved by default .
Parameter description :
data source : choice ODPS>odps_first data source .
explain :
odps_first The data source is a workspace binding MaxCompute When an instance , The default data source automatically generated by the system .
    odps_first The data source is written to... In the current workspace MaxCompute In the project .
     surface : Select... In the data source ods_raw_log_d surface .

In the time attribute area of the scheduling configuration panel , The rerun attribute can be selected as rerun after successful or failed operation . In the output area of this node of the scheduling dependency panel , Enter the output name of this node as the workspace name .ods_raw_log_d, Click Add .
explain : You can view the workspace name in the cloud product resource list 
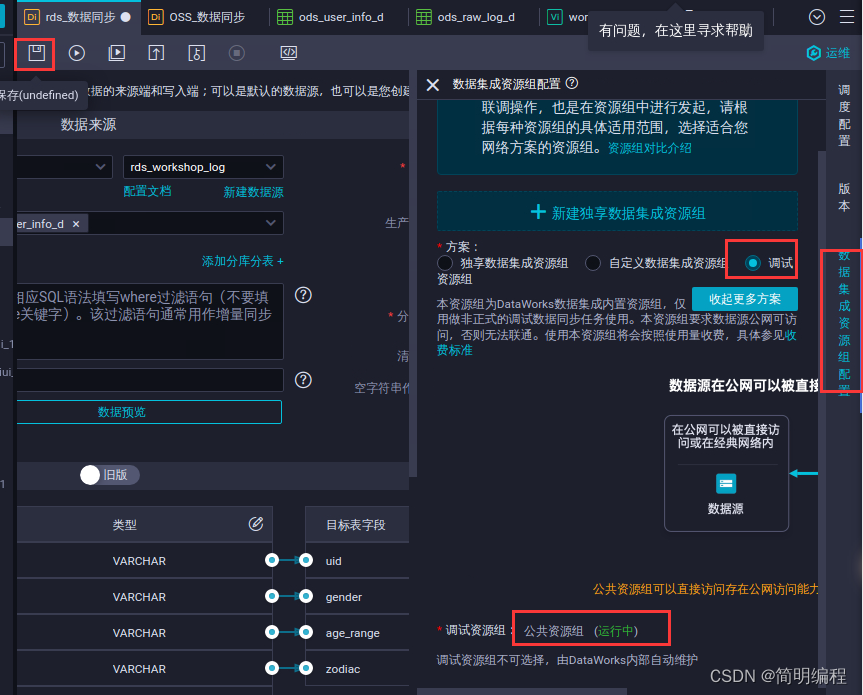
In the data integration resource group configuration panel , Click more options .
In the data integration resource group configuration panel , Scheme selection debug resource group 
On the left side of the data development page , Select the business process > Data integration , double-click rds_di( In the figure below rds_ Data synchronization ).
stay rds_di The data source of the page , Configure the following parameters , Other configurations remain default .
Parameter description :
 data source : choice MySQL>rds_workshop_log data source .
     surface : Select... In the data source ods_user_info_d surface .

stay rds_di The data destination of the page , Configure the following parameters , Other configurations are saved by default .
Parameter description :
 data source : choice ODPS>odps_first data source .
     surface : Select... In the data source ods_user_info_d surface .

In the time attribute area of the scheduling configuration panel , The rerun attribute can be selected as rerun after successful or failed operation . In the output area of this node of the scheduling dependency panel , Enter the output name of this node as the workspace name .ods_user_info_d, Click Add .
explain : You can view the workspace name in the cloud product resource list .
In the data integration resource group configuration panel , Click more options .
Submit the business process .
On the left side of the data development page , Double click your business process .


Return to the following page , Wait for all nodes to submit successfully , single click Icon .
Running business processes
In the upper menu bar , single click Icon .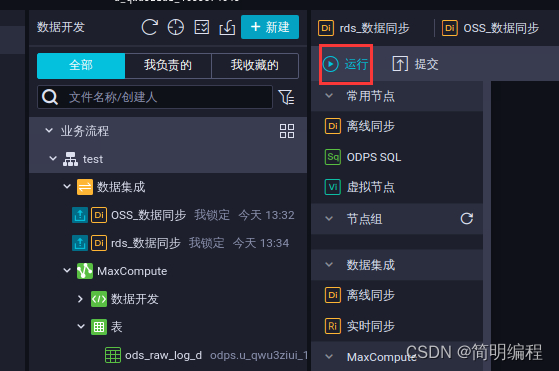
On the edit page of the business process , Right click rds_di( In the figure below rds_ Data synchronization ).


Confirm whether the data is successfully imported MaxCompute.
On the left navigation bar of the data development page , single click Icon .

On the left side of the temporary query page , Right click temporary query , Select new node >ODPS SQL.

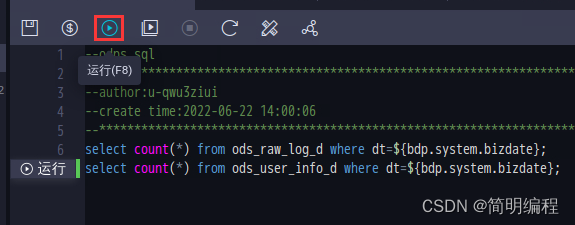
stay SQL Query tab , Enter the following SQL sentence , single click Icon , View import ods_raw_log_d and ods_user_info_d Number of records .
explain :SQL Fields in the statement dt You need to update to business date . for example , The date the task was run is 20180717, Then the business date is 20180716, That is, the day before the task running date .
select count(*) from ods_raw_log_d where dt=${
    bdp.system.bizdate};
select count(*) from ods_user_info_d where dt=${
    bdp.system.bizdate};


adopt DataWorks Calculate and analyze the collected data
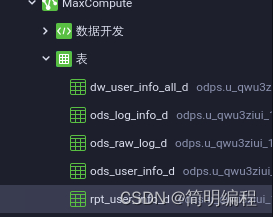
Create three data tables
They are data operation layer tables (ods_log_info_d)、 Data warehouse layer table (dw_user_info_all_d) And data product layer table (rpt_user_info_d)
In the left navigation of the temporary query page , single click Icon .
In the new table dialog box , The table name is entered as ods_log_info_d, Click Submit .
In the table ods_log_info_d Edit page for , single click DDL Pattern .
stay DDL Mode dialog , Enter the following statement to create the data operation layer table , Click generate table structure .
CREATE TABLE IF NOT EXISTS ods_log_info_d (
  ip STRING COMMENT 'ip',
  uid STRING COMMENT 'uid',
  time STRING COMMENT 'timeyyyymmddhh:mi:ss',
  status STRING COMMENT 'status',
  bytes STRING COMMENT 'bytes',
  region STRING COMMENT 'region',
  method STRING COMMENT 'method',
  url STRING COMMENT 'url',
  protocol STRING COMMENT 'protocol',
  referer STRING COMMENT 'referer',
  device STRING COMMENT 'device',
  identity STRING COMMENT 'identity'
)
PARTITIONED BY (
  dt STRING
);

In the table ods_log_info_d Edit page for , The Chinese name is entered as the data operation layer table , Click submit to production .
Repeat the above steps , Create a table according to the following statement , newly build dw_user_info_all_d Table and rpt_user_info_d surface , The Chinese names are entered as data warehouse layer table and data product layer table respectively , Then click submit to production .
CREATE TABLE IF NOT EXISTS dw_user_info_all_d (
  uid STRING COMMENT 'uid',
  gender STRING COMMENT 'gender',
  age_range STRING COMMENT 'age_range',
  zodiac STRING COMMENT 'zodiac',
  region STRING COMMENT 'region',
  device STRING COMMENT 'device',
  identity STRING COMMENT 'identity',
  method STRING COMMENT 'method',
  url STRING COMMENT 'url',
  referer STRING COMMENT 'referer',
  time STRING COMMENT 'timeyyyymmddhh:mi:ss'
)
PARTITIONED BY (
  dt STRING
);
CREATE TABLE IF NOT EXISTS rpt_user_info_d (
  uid STRING COMMENT 'uid',
  region STRING COMMENT 'uid',
  device STRING COMMENT 'device',
  pv BIGINT COMMENT 'pv',
  gender STRING COMMENT 'gender',
  age_range STRING COMMENT 'age_range',
  zodiac STRING COMMENT 'zodiac'
)
PARTITIONED BY (
  dt STRING
);
Design business processes
On the left side of the data development page , Double click your business process .
In the business process development panel , single click ODPS SQL And drag it to the edit page on the right .
In the new node dialog , The node name is entered as ods_log_info_d, Click Submit .
In the new node dialog , The node name is entered as dw_user_info_all_d, Click Submit .

In the new node dialog , The node name is entered as rpt_user_info_d, Click Submit .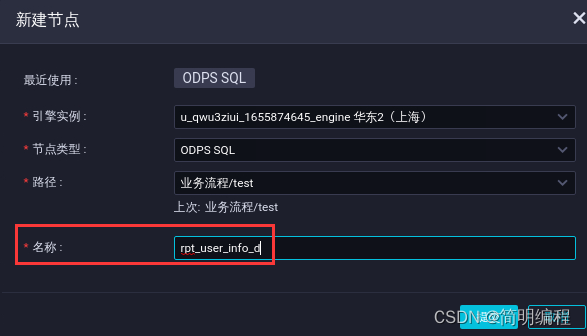
On the right side of the edit page , By dragging and dropping the connection , Configure the dependencies shown in the following figure

Create user defined functions .
Copy the address below , stay Chromium The browser opens a new tab , Paste and access , download ip2region.jar.
https://docs-aliyun.cn-hangzhou.oss.aliyun-inc.com/assets/attach/85298/cn_zh/1532163718650/ip2region.jar?spm=a2c4g.11186623.0.0.43df4d0dwSRLzd&file=ip2region.jar
On the data development page , Select the business process > Your business processes >MaxCompute, Right click the resource , Choose new >JAR.


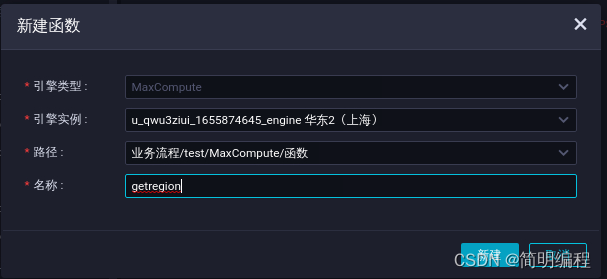
On the data development page , Select the business process > Your business processes >MaxCompute, Right click the function , Click new function .

In the new function dialog box , The function name is entered as getregion, Click New .
On the register function tab , Configure the following parameters , Other configurations remain default , single click Icon .
Parameter description :
 Class name : Input org.alidata.odps.udf.Ip2Region.
     resource list : Input ip2region.jar.
     describe : Input IP Address translation region .
     Command format : Input getregion(‘ip’).
     Parameter description : Input IP Address .


To configure ODPS SQL node
On the data development page , Select the business process > Your business processes >MaxCompute> Data development , double-click ods_log_info_d.

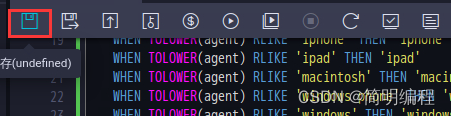
stay ods_log_info_d Node edit page , Enter the following SQL sentence , single click Icon .
INSERT OVERWRITE TABLE ods_log_info_d PARTITION (dt=${
    bdp.system.bizdate})
SELECT ip
  , uid
  , time
  , status
  , bytes
  , getregion(ip) AS region -- Use customization UDF adopt IP Get the region .
  , regexp_substr(request, '(^[^ ]+ )') AS method -- By regularizing request The difference is 3 A field .
  , regexp_extract(request, '^[^ ]+ (.*) [^ ]+$') AS url
  , regexp_substr(request, '([^ ]+$)') AS protocol
  , regexp_extract(referer, '^[^/]+://([^/]+){
    1}') AS referer -- By regular clarity refer, Get more accurate URL.
  , CASE
    WHEN TOLOWER(agent) RLIKE 'android' THEN 'android' -- adopt agent Get terminal information and access form .
    WHEN TOLOWER(agent) RLIKE 'iphone' THEN 'iphone'
    WHEN TOLOWER(agent) RLIKE 'ipad' THEN 'ipad'
    WHEN TOLOWER(agent) RLIKE 'macintosh' THEN 'macintosh'
    WHEN TOLOWER(agent) RLIKE 'windows phone' THEN 'windows_phone'
    WHEN TOLOWER(agent) RLIKE 'windows' THEN 'windows_pc'
    ELSE 'unknown'
  END AS device
  , CASE
    WHEN TOLOWER(agent) RLIKE '(bot|spider|crawler|slurp)' THEN 'crawler'
    WHEN TOLOWER(agent) RLIKE 'feed'
    OR regexp_extract(request, '^[^ ]+ (.*) [^ ]+$') RLIKE 'feed' THEN 'feed'
    WHEN TOLOWER(agent) NOT RLIKE '(bot|spider|crawler|feed|slurp)'
    AND agent RLIKE '^[Mozilla|Opera]'
    AND regexp_extract(request, '^[^ ]+ (.*) [^ ]+$') NOT RLIKE 'feed' THEN 'user'
    ELSE 'unknown'
  END AS identity
  FROM (
    SELECT SPLIT(col, '##@@')[0] AS ip
    , SPLIT(col, '##@@')[1] AS uid
    , SPLIT(col, '##@@')[2] AS time
    , SPLIT(col, '##@@')[3] AS request
    , SPLIT(col, '##@@')[4] AS status
    , SPLIT(col, '##@@')[5] AS bytes
    , SPLIT(col, '##@@')[6] AS referer
    , SPLIT(col, '##@@')[7] AS agent
  FROM ods_raw_log_d
  WHERE dt = ${
    bdp.system.bizdate}
) a;

On the data development page , Select the business process > Your business processes >MaxCompute> Data development , double-click dw_user_info_all_d.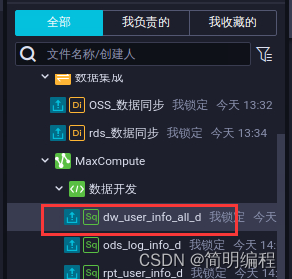
stay dw_user_info_all_d Node edit page , Enter the following SQL sentence , single click Icon .
INSERT OVERWRITE TABLE dw_user_info_all_d PARTITION (dt='${
    bdp.system.bizdate}')
SELECT COALESCE(a.uid, b.uid) AS uid
  , b.gender
  , b.age_range
  , b.zodiac
  , a.region
  , a.device
  , a.identity
  , a.method
  , a.url
  , a.referer
  , a.time
FROM (
  SELECT *
  FROM ods_log_info_d
  WHERE dt = ${
    bdp.system.bizdate}
) a
LEFT OUTER JOIN (
  SELECT *
  FROM ods_user_info_d
  WHERE dt = ${
    bdp.system.bizdate}
) b
ON a.uid = b.uid;

On the data development page , Select the business process > Your business processes >MaxCompute> Data development , double-click rpt_user_info_d.
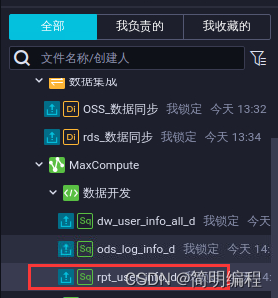
stay rpt_user_info_d Node edit page , Enter the following SQL sentence , single click Icon .

Submit the business process
On the left side of the data development page , Double click your business process .

In the menu bar above the edit page of the business process , single click Icon , Submit the configured nodes in the business process .

In the submit dialog , Select all nodes , Note enter submit business process , Select to ignore the alarm of inconsistent input and output , Click Submit .

Running business processes .
In the menu bar above the edit page of the business process , single click Icon .

In the left navigation bar , single click Icon
In the temporary query panel , Right click temporary query , Select new node >ODPS SQL.
In the new node dialog , Click Submit .
stay SQL Query tab , Enter the following SQL sentence , single click Icon , see rpt_user_info_d Data , Confirm data output .
explain :SQL Fields in the statement dt You need to update to business date . for example , The date the task was run is 20180717, Then the business date is 20180716, That is, the day before the task running date .
select * from rpt_user_info_d where dt=${
    bdp.system.bizdate} limit 10;


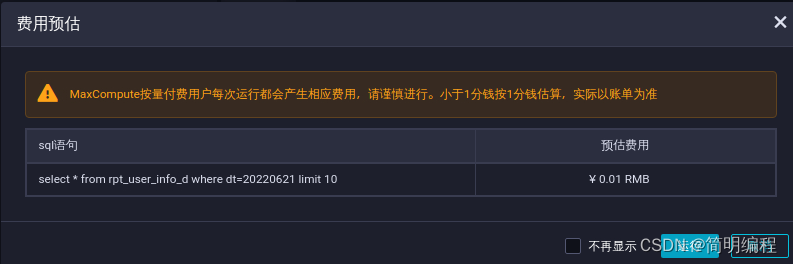
Returns the following , Indicates that the data has been produced 
Running tasks in a production environment .
At the top of the publish list page , Click O & M Center .

On the O & M center page , Select periodic task operation and maintenance > Cycle task .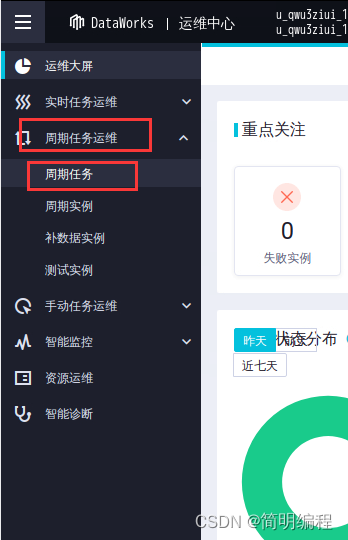
On the cycle task page , single click workshop_start The business process .

stay DAG In the figure , Right click workshop_start node , Select supplementary data > Current node and downstream node .

In the supplementary data dialog box , Select all tasks , Click OK .

Return to the following page , Click refresh , wait for 3~5 minute , Until all tasks run successfully .
Monitoring data quality 、 Set the quality monitoring rules and monitoring reminders of the table
Enter table ods_raw_log_d Monitoring rules page of .
stay Chromium In the web browser , Switch to the data development tab . Click the icon at the top left , Select all products > Data governance > Data quality .

In the left navigation bar , Select rule configuration > Configure according to the table .
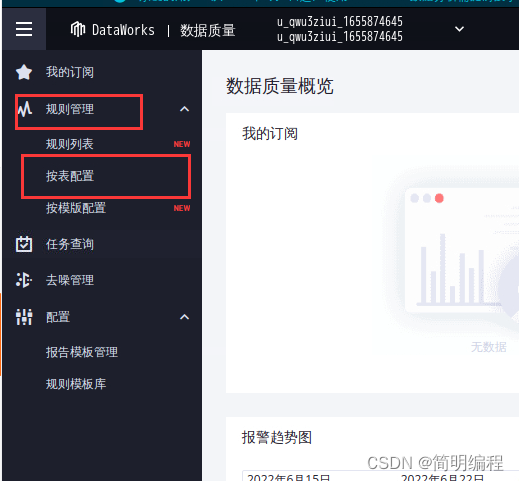
On the configure by table page , single click ods_raw_log_d Configuration monitoring rules after the table .
Configuration table ods_raw_log_d Monitoring rules for .
In the partition expression module , single click +.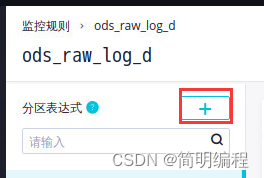
In the add partition dialog , Partition expression selection dt=$[yyyymmdd-1], Click OK .

In the table ods_raw_log_d Monitoring rules page of , Click Create rule .

In the create rule panel , Select template rule > Add monitoring rule .

In the create rule panel , Configure relevant parameters as follows , Other configurations remain default , Click batch add .
explain : This rule is mainly to avoid no data in the partition , The data source of the downstream task is empty .
Parameter description :
 Rule name : Input ods_raw_log_d Table rules .
     Strong and weak : Select strong .
     Rule templates : Select the number of table rows , Fixed value .
     Comparison mode : The choice is greater than

In the configuration table ods_raw_log_d Monitoring rules page of , Click test run 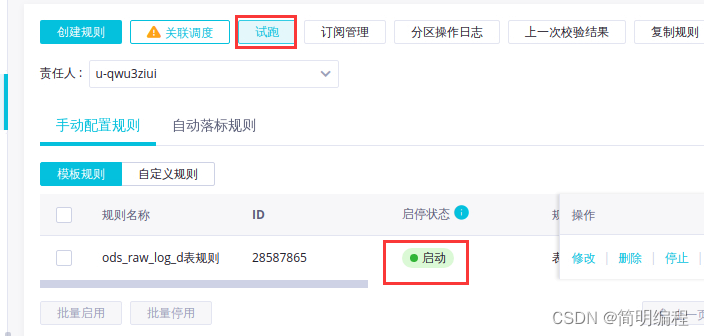


Perform associated scheduling .
Data quality support is associated with scheduling tasks . After the table rule is bound to the scheduling task , After the task instance runs, the data quality check will be triggered .
In the table ods_raw_log_d Monitoring rules page of , Click associate schedule .

In the associated scheduling dialog box , The task node name is entered as oss_ Data synchronization , Click Add .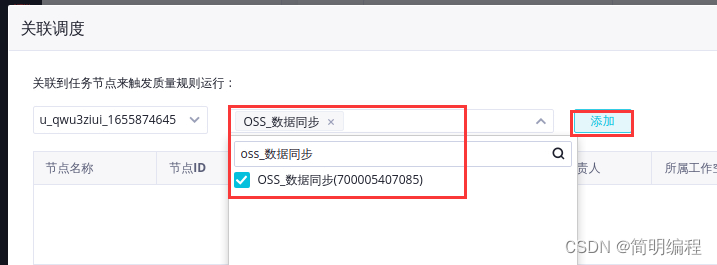

To configure ods_user_info_d Table rules .
explain :ods_user_info_d Is the user information table , When you configure rules , You need to configure the table row number verification and primary key uniqueness verification , Avoid data duplication .
stay Chromium In the web browser , Switch to the configuration by table tab . On the configure by table page , single click ods_user_info_d Configuration monitoring rules after the table .
In the partition expression module , single click +


In the table ods_user_info_d Monitoring rules page of , Click Create rule
In the create rule panel , Configure relevant parameters as follows , Other configurations remain default , Click Add monitoring rule .
Parameter description :
 Rule name : Enter table level rules .
     Strong and weak : Select strong .
     Rule templates : Select the number of table rows , Fixed value .
     Comparison mode : The choice is greater than .
     Expectations : Input 0.

In the create rule panel , Configure relevant parameters as follows , Other configurations remain default , Click batch add .
Parameter description :
 Rule name : Enter column rule .
     Strong and weak : Select weak .
     Rule field : choice uid(string).
     Rule templates : Select the number of duplicate values , Fixed value .
     Comparison mode : Choose less than .
     Expectations : Input 1.

To configure ods_log_info_d Table rules
ods_log_info_d The data mainly comes from analysis ods_raw_log_d Table data . Since the data in the log cannot be configured with too much monitoring , You only need to configure the verification rule that the table data is not empty .
stay Chromium In the web browser , Switch to the configuration by table tab . On the configure by table page , single click ods_log_info_d Configuration monitoring rules after the table .

In the add partition dialog , Partition expression selection dt=$[yyyymmdd-1], Click OK .
In the create rule panel , Configure relevant parameters as follows , Other configurations remain default , Click batch add .
Parameter description :
 Rule name : Input ods_log_info_d Table level rules .
     Strong and weak : Select strong .
     Rule templates : Select the number of table rows , Fixed value .
     Comparison mode : Choice doesn't mean .
     Expectations : Input 0.

To configure rpt_user_info_d Table rules .
stay Chromium In the web browser , Switch to the configuration by table tab . On the configure by table page , single click rpt_user_info_d Configuration monitoring rules after the table .

In the add partition dialog , Partition expression selection dt=$[yyyymmdd-1], Click OK .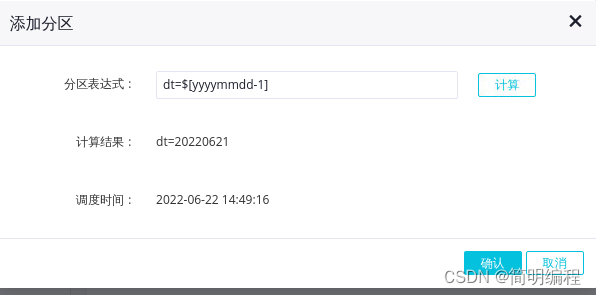
In the create rule panel , Configure relevant parameters as follows , Other configurations remain default , Click Add monitoring rule .
Parameter description :
 The rules of : Input rpt_user_info_d Column level rules .
     Strong and weak : Select weak .
     Rule field : choice uid(string).
     Rule templates : Select the number of duplicate values , Fixed value .
     Comparison mode : Choose less than .
     Expectations : Input 1

In the create rule panel , Configure relevant parameters as follows , Other configurations remain default , Click batch add .
Parameter description :
 Rule name : Input rpt_user_info_d Table level rules .
     Strong and weak : Select weak .
     Rule templates : Select the number of table rows ,7 Day volatility .
     Orange threshold : Input 1.

adopt Quick BI Create a dashboard for user analysis portraits of a website , Implement data table rpt_user_info_d Visualization
Copy the following address , stay Chromium The web browser opens a new tab , Paste and access Quick BI Console .
http://das.base.shuju.aliyun.com/console.htm


On the data source page , Click new data source... In the upper right .

In the add data source dialog box , Choose cloud database >MaxCompute.
Adding MaxCompute In the data source dialog box , Configure the following parameters , Click connection test , After the data source connectivity is normal , Click OK .
Parameter description :
 The display name : Custom display name , An example is test.
 Database address : Use default address , There is no need to modify .
 Project name : Input MaxCompute Project name .
AcessKey ID: Enter the... Of the sub account AccessKey ID.
AcessKey Secret: Enter the... Of the sub account AcessKey Secret.
explain : You can view... In the cloud product resource list MaxCompute Project name 、AccessKey ID and AcessKey Secret.


On the data source page , Select the data source you just added , Click synchronize and refresh page .
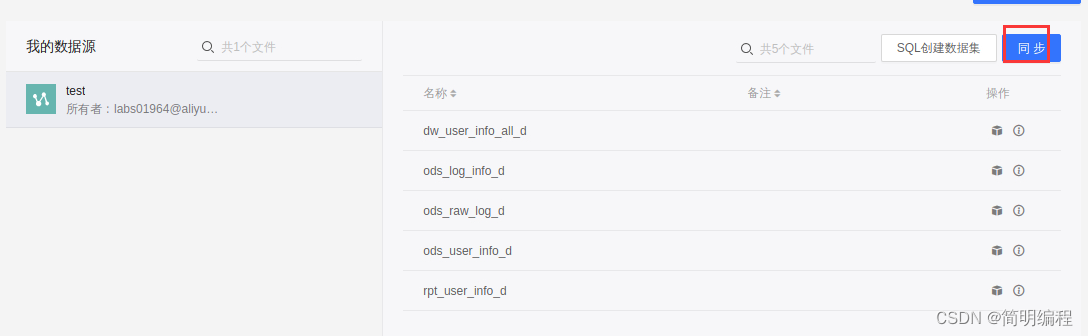
On the data source page , find rpt_user_info_d surface , Click under the action column Icon .

Convert the dimension type of the field
Convert the dimension type of the date field .
In the dimension area of the dataset edit page , Right click dt Field , Select dimension type switch > date >yyyyMMdd.

Convert the dimension type of geographic information field ( Ignore )
Note here , According to my experimental verification, the conversion will report an error !!!
In the dimension area of the dataset edit page , Right click region Field , Select dimension type switch > Geography > province / Municipalities directly under the central government .

Save the data set
In the save dataset dialog box , The name is entered as rpt_user, Location select the root directory , Click OK .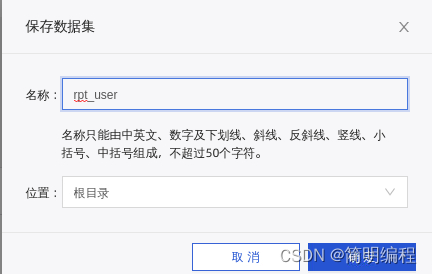
Make a dashboard .
As the data is updated , Let the report visually show the latest data , This process is called making a dashboard . The production process of the dashboard is : Determine content 、 Layout and style 、 Make charts and complete dynamic linkage query .
On the dataset edit page , Select Start analysis at the top right > Create a dashboard .

On the right side of the dashboard edit page , Click on the line graph , Select indicators > Index Kanban .
In the data panel , Put... In the dimension dt(year) Drag to filter , Will measure pv Drag to Kanban indicator / Measure .

In the indicator Kanban panel , Click in filter dt(year) Of Icon

In the set Filter dialog , The filter condition starts when the input is 0, The end of the filter condition is entered as 0, Click OK .
In the indicator Kanban panel , Click Update .


In the upper menu bar , Drag the line graph to the canvas below .
In the data panel , The dimension of dt(day) Drag to category axis / dimension , Will measure pv Drag to the value axis / Measure , The dimension of age_range Drag to color legend / dimension , Put... In the dimension dt(year) Drag to filter .

Online diagram panel , Click in filter dt(year) Of Icon .
Online diagram panel , Click Update
The result is shown in Fig.

边栏推荐
- (CVE-2020-11978)Airflow dag中的命令注入漏洞复现【vulhub靶场】
- [signal recognition] signal modulation classification based on deep learning CNN with matlab code
- How to turn on win11 notebook power saving mode? How to open win11 computer power saving mode
- MySQL enable binlog
- Several misunderstandings of VPN
- Global and Chinese market of inline drip irrigation 2022-2028: Research Report on technology, participants, trends, market size and share
- Reppoints: Microsoft skillfully uses deformation convolution to generate point sets for target detection, full of creativity | iccv 2019
- [GUET-CTF2019]zips
- Global and Chinese market of bed former 2022-2028: Research Report on technology, participants, trends, market size and share
- [tips] use the deep learning toolbox of MATLAB deepnetworkdesigner to quickly design
猜你喜欢

只显示两行,超出部分省略号显示
![[image fusion] image fusion based on pseudo Wigner distribution (PWD) with matlab code](/img/e0/14cd7982fb3059fed235470d91126e.png)
[image fusion] image fusion based on pseudo Wigner distribution (PWD) with matlab code

JVM debugging tool -jmap
![[wustctf2020] climb](/img/b6/4a0582144c3125e7a0666bbbbfe29d.png)
[wustctf2020] climb

More than 60 million shovel excrement officials, can they hold a spring of domestic staple food?

MySQL enable binlog

What is the mentality of spot gold worth learning from
![[image fusion] image fusion based on NSST and PCNN with matlab code](/img/b4/61a5adde0d0bfc5a339ef8ab948d43.png)
[image fusion] image fusion based on NSST and PCNN with matlab code

Blue Bridge Cup seven segment code (dfs/ shape pressing + parallel search)
![[OGeek2019]babyrop](/img/74/5f93dcee9ea5a562a7fba5c17aab76.png)
[OGeek2019]babyrop
随机推荐
Super fast reading in OI
简单使用Modbus转BACnet网关教程
How can win11 set the CPU performance to be fully turned on? How does win11cpu set high performance mode?
[equalizer] bit error rate performance comparison simulation of LS equalizer, def equalizer and LMMSE equalizer
Lend you a pair of insight, Frida native trace
What are the dazzling skills of spot gold?
[WUSTCTF2020]alison_likes_jojo
[Proteus] Arduino uno + ds1307+lcd1602 time display
20 not to be missed ES6 tips
使用SystemParametersInfo访问用户界面设置
光照使用的简单总结
[WUSTCTF2020]alison_ likes_ jojo
What is a CC attack? How to judge whether a website is attacked by CC? How to defend against CC attacks?
Commandes de console communes UE
Reconfiguration of nebula integration testing framework based on BDD theory (Part 2)
[MySQL usage Script] clone data tables, save query data to data tables, and create temporary tables
How to open the soft keyboard in the computer, and how to open the soft keyboard in win10
什么是CC攻击?如何判断网站是否被CC攻击? CC攻击怎么防御?
MFC multithreaded semaphore csemaphore critical area and mutually exclusive events
[vulhub shooting range]] ZABBIX SQL injection (cve-2016-10134) vulnerability recurrence