当前位置:网站首页>人脸识别 确定阈值
人脸识别 确定阈值
2022-06-23 03:56:00 【AI视觉网奇】
目录
face TAR FAR计算:
人脸识别中的阈值应该如何设置?
人脸识别中的阈值应该如何设置?
随着人脸识别技术使用范围越来越广,大部分使用者可能对人脸识别中的某一方面不是很懂,咨询的问题也五花八门,下面,主要讲解视壮人脸识别中的阈值应该如何设置?
首先我们来看看提供的一组数据(绝对数值有修改,可以定性来看)。
误识率 | 通过率 | 阈值 |
0.01 | 0.999 | 64 |
0.001 | 0.998 | 68 |
0.0001 | 0.996 | 72 |
1e-5 | 0.993 | 76 |
1e-6 | 0.985 | 80 |
1e-7 | 0.950 | 84 |
1e-8 | 0.300 | 88 |
通过这组数据,可以得出以下结论:
一是误识率、通过率和阈值具有相关性,但属于非线性关系
可能大部分人看到这组数据,就会认为阈值越高,通过率和误识率越低,阈值越低,通过率和误识率越高。
这就引出了一个常见的误区,客户认为通过率越高,体验越好,那么阈值就应该设置越低。但是通过率越高,误识率也就越高,意味着防风险能力就会下降,所以阈值的设置要综合考虑客户体验和防风险能力两个因素。较准确的说法应该是在指定阈值下,公司A的通过率比其他公司高,误识率也比其他公司低,,这就说明公司A的人脸识别算法比其他公司要好。
另外阈值不能设置过高,从数据可以看出,阈值不断提高后,通过率和误识率也跟着急速下降。当前人脸识别只能作为辅助认证手段,不能等同于二代Key这样的强认证工具,人脸数据量如果足够大,一定会出现误识,没有办法做到风险为0。
提供的这组数据是基于他们自己人脸识别测试底库,阈值、误识率和通过率并不是绝对的。不过从定性的角度来看,还是值得参考的。如果测试底库有大量多胞胎,或者人脸库数据规模超级大,那么所得结果一定会有所差异。
python画roc曲线:
# -*- coding: utf-8 -*-
"""
Created on Thu Sep 21 16:13:04 2017
@author: lizhen
"""
import numpy as np
import matplotlib.pyplot as plt
from sklearn import svm, datasets
from sklearn.metrics import roc_curve, auc ###计算roc和auc
from sklearn import model_selection as cross_validation
# Import some data to play with
iris = datasets.load_iris()
X = iris.data
y = iris.target
##变为2分类
X, y = X[y != 2], y[y != 2]
# Add noisy features to make the problem harder
random_state = np.random.RandomState(0)
n_samples, n_features = X.shape
X = np.c_[X, random_state.randn(n_samples, 200 * n_features)]
# shuffle and split training and test sets
X_train, X_test, y_train, y_test = cross_validation.train_test_split(X, y, test_size=.3, random_state=0)
# Learn to predict each class against the other
svm = svm.SVC(kernel='linear', probability=True, random_state=random_state)
###通过decision_function()计算得到的y_score的值,用在roc_curve()函数中
y_score = svm.fit(X_train, y_train).decision_function(X_test)
# Compute ROC curve and ROC area for each class
fpr, tpr, threshold = roc_curve(y_test, y_score) ###计算真正率和假正率
roc_auc = auc(fpr, tpr) ###计算auc的值
plt.figure()
lw = 2
plt.figure(figsize=(10, 10))
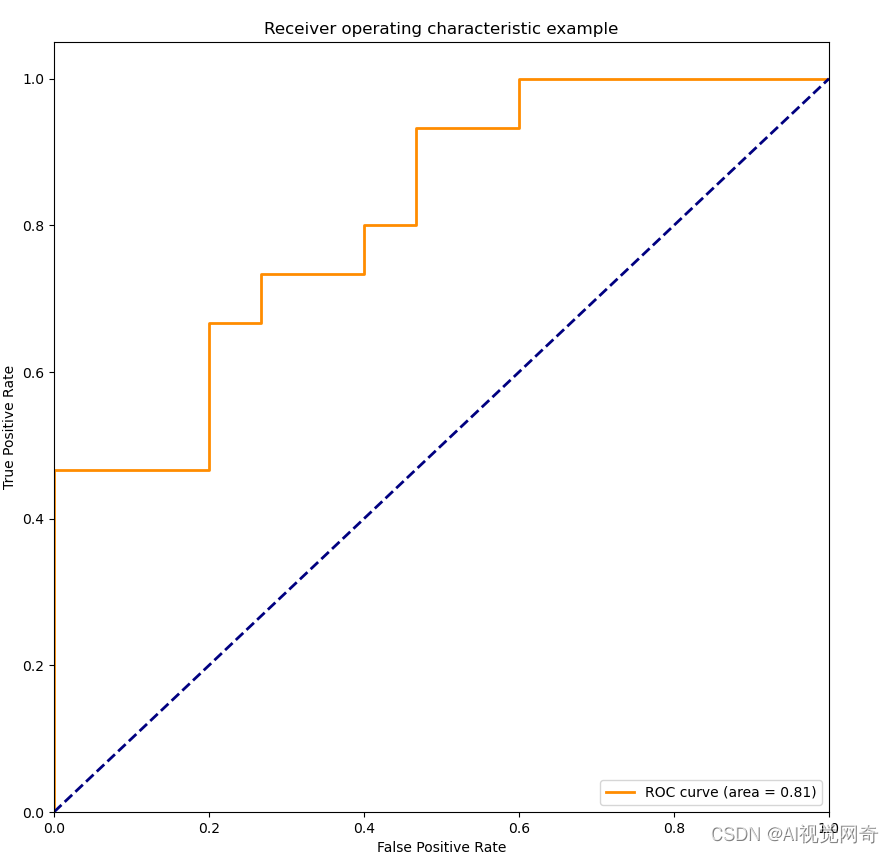
plt.plot(fpr, tpr, color='darkorange', lw=lw, label='ROC curve (area = %0.2f)' % roc_auc) ###假正率为横坐标,真正率为纵坐标做曲线
plt.plot([0, 1], [0, 1], color='navy', lw=lw, linestyle='--')
plt.xlim([0.0, 1.0])
plt.ylim([0.0, 1.05])
plt.xlabel('False Positive Rate')
plt.ylabel('True Positive Rate')
plt.title('Receiver operating characteristic example')
plt.legend(loc="lower right")
plt.show()
roc曲线:
转自:用Python绘制ROC曲线_-永不妥协-的博客-CSDN博客_python做roc曲线
from sklearn.metrics import roc_curve, auc # 数据准备
import numpy as np
from sklearn import metrics
import matplotlib.pyplot as plt
y = np.array([1, 1,1, 2, 2,2])
scores = np.array([0.1, 0.4,0.5, 0.35, 0.8,0.9])
# roc_curve的输入为
# y: 样本标签
# scores: 模型对样本属于正例的概率输出
# pos_label: 标记为正例的标签,本例中标记为2的即为正例
fpr, tpr, thresholds = metrics.roc_curve(y, scores, pos_label=2) # 假阳性率
print(fpr)
# array([0., 0.5, 0.5, 1.]) # 真阳性率
print(tpr)
# array([0.5, 0.5, 1., 1.]) # 阈值
print(thresholds)
# array([0.8, 0.4, 0.35, 0.1])
auc = metrics.auc(fpr, tpr)
print(auc)
plt.figure()
lw = 2
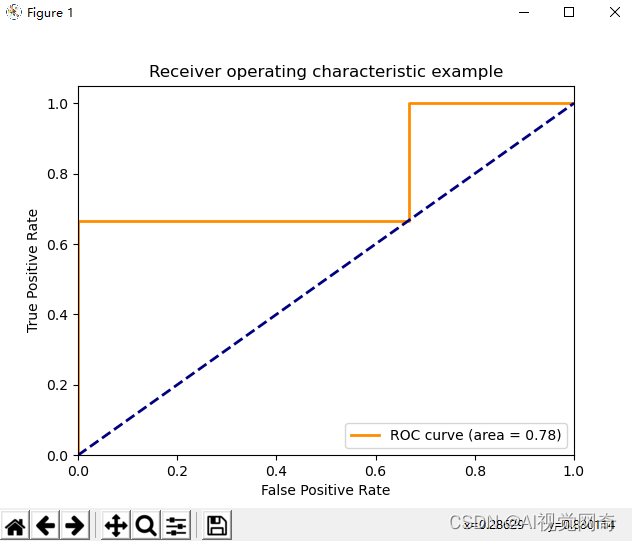
plt.plot(fpr, tpr, color='darkorange', lw=lw, label='ROC curve (area = %0.2f)' % auc)
plt.plot([0, 1], [0, 1], color='navy', lw=lw, linestyle='--')
plt.xlim([0.0, 1.0])
plt.ylim([0.0, 1.05])
plt.xlabel('False Positive Rate')
plt.ylabel('True Positive Rate')
plt.title('Receiver operating characteristic example')
plt.legend(loc="lower right")
plt.show()
边栏推荐
- Implementation of slider view
- ES6的Array.from方法创建长度为N的undefined数组
- Laravel8 implementation of picture verification code
- STP总结
- Difficult to find a job in a bad environment? Ali on three sides. Fortunately, he has made full preparations and has offered
- pkav简单爆破
- MCS: continuous random variable lognormal distribution
- 戏问花门酒家翁
- HCIP 交换机实验
- JVM原理之内存模型
猜你喜欢

MCS:连续随机变量——Chi-Square分布

计算欧式距离和余弦相似度

Arduino temperature and humidity sensor DHT11 (including code)

Baidu PaddlePaddle's "universal gravitation" first stop in 2022 landed in Suzhou, comprehensively launching the SME empowerment plan
九九乘法表.bat

Jetpack compose menubar Desktop Menu from door opening to entry

【opencv450】帧间差分法

Array The from method creates an undefined array of length n
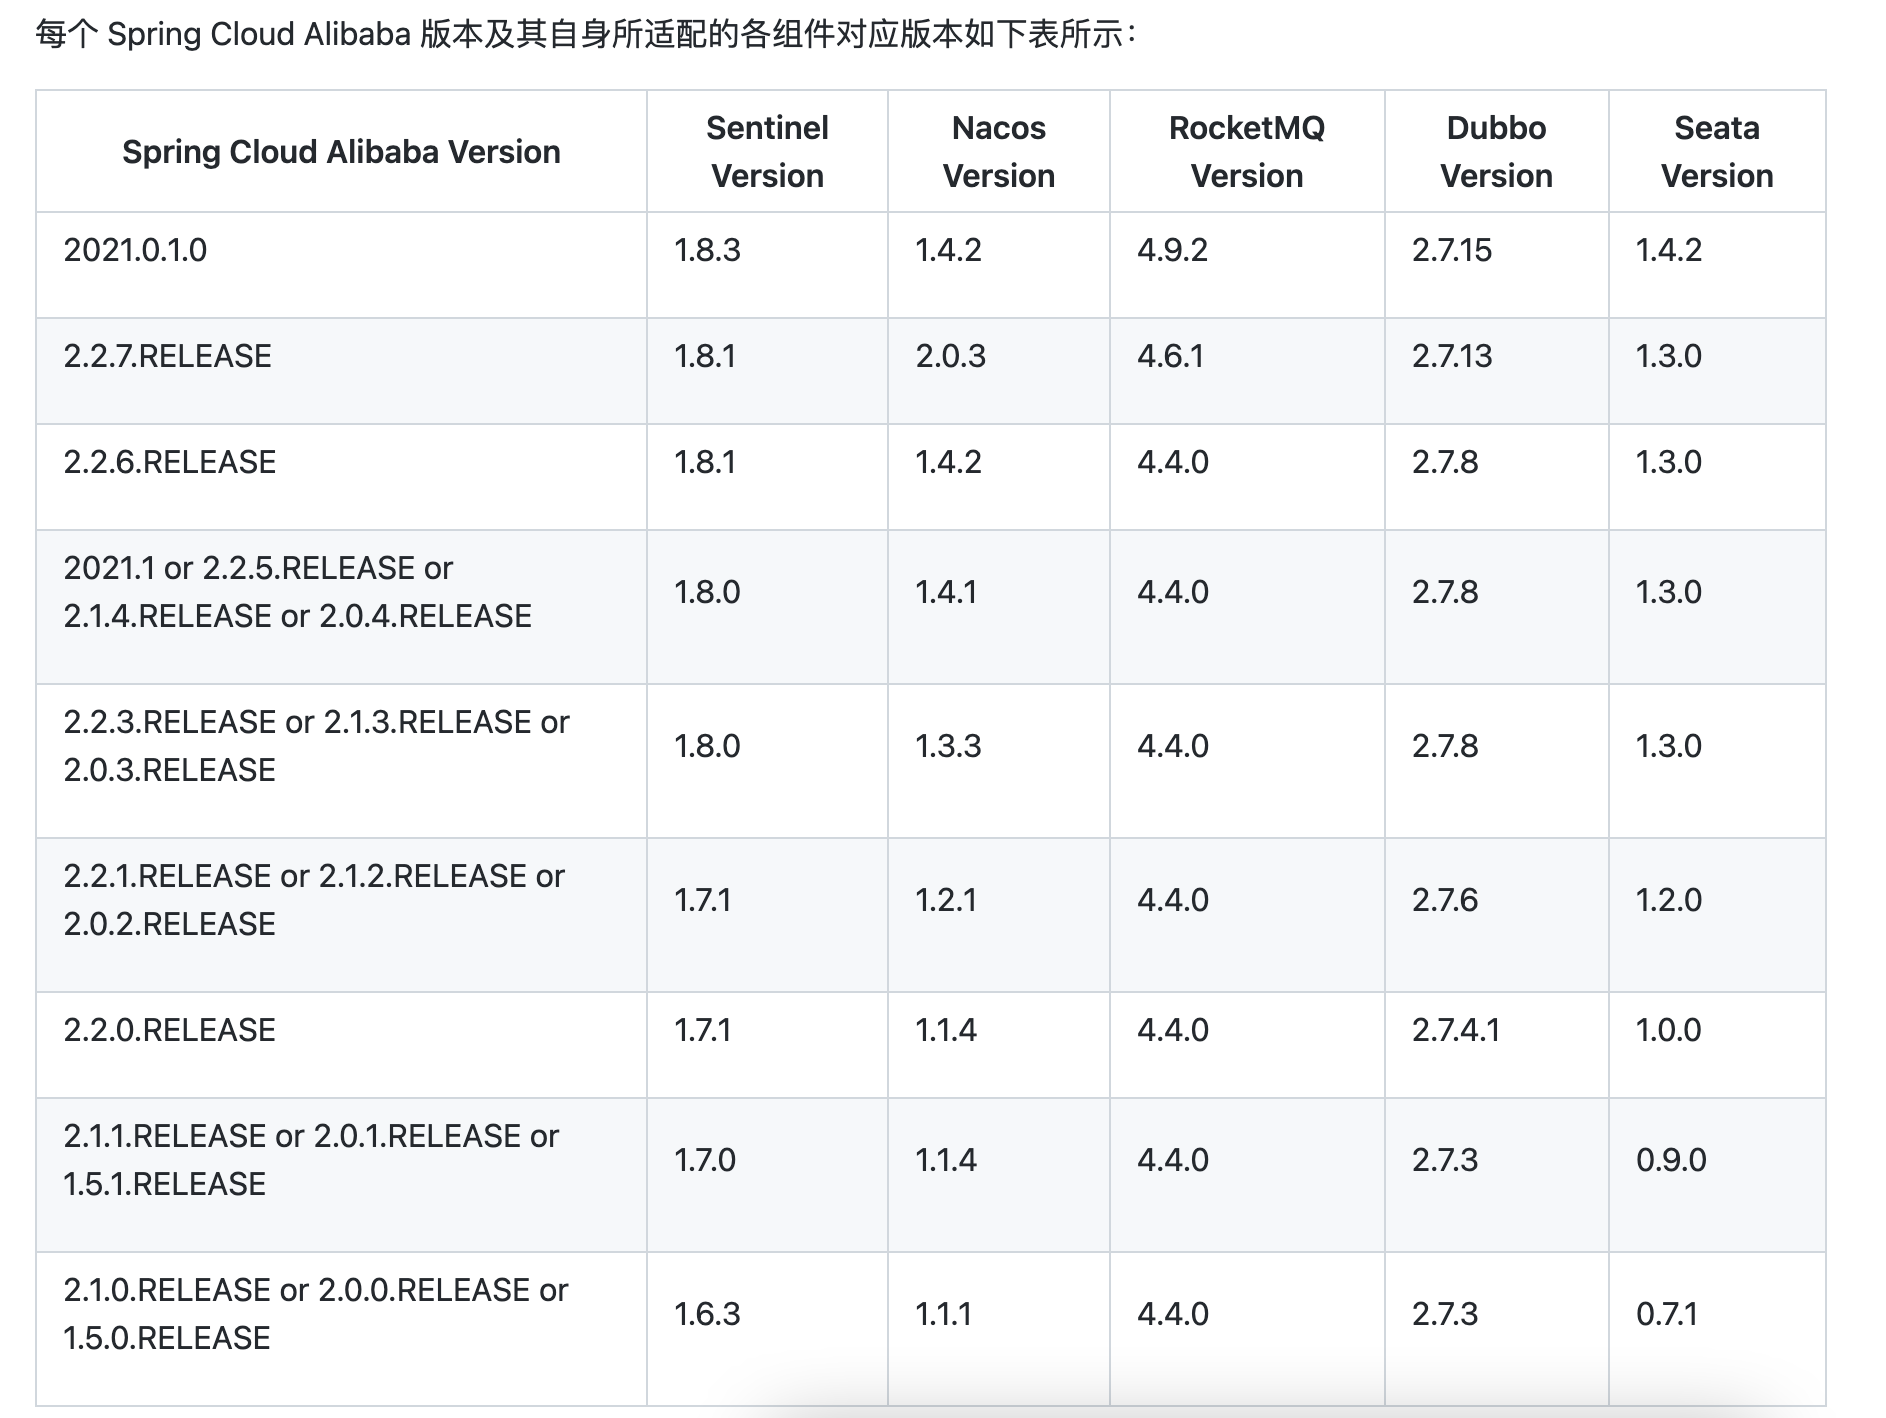
【微服务|Nacos】Nacos版本相关问题一览

TIOBE 编程语言排行榜是编程语言流行趋势的一个指标
随机推荐
Get bat command results in bat
Introduction to s file generated by TEQC for GNSS data quality analysis
TIOBE 编程语言排行榜是编程语言流行趋势的一个指标
App hangs~
Economic development is driven by new technology
8 years' experience: monthly salary of 3000 to 30000, the change of Test Engineer
【opencv450】帧间差分法
关于信息泄露和防御
Swiftui 2.0 course notes Chapter 5
网上有真实的兼职吗?大学生怎么找暑期兼职?
渗透测试基础 | 附带测试点、测试场景
Un processus GC complet pour le principe JVM
组合式API-composition-api
HCIP 交换机实验
[microservices | Nacos] list of issues related to the Nacos version
Jenkins安装部署以及自动构建和发布jar应用
Drag and drop frame
关于重放攻击和防御
1010 Radix
Event日志关键字:EventLogTags.logtags