当前位置:网站首页>Sampling method and descriptive statistical function in R language
Sampling method and descriptive statistical function in R language
2022-06-25 15:11:00 【A window full of stars and milky way】
sampling method
Common sampling methods
- Simple random sampling
- Stratified sampling
- Systematic sampling
#  Import data
# 1  Finance   2  Architecture    3  Foreign Languages
data <- read.csv("E:\\Github\\code-learning\\R\\data\\ The first 11 Period data \\data.csv")
#  According to the specialty and ID Sort
data <- data[order(data$ major ,data$ID),]
head(data)
| major | ID | income | |
|---|---|---|---|
| 375 | 1 | A001 | 6811 |
| 360 | 1 | A002 | 3976 |
| 505 | 1 | A003 | 2692 |
| 470 | 1 | A004 | 8156 |
| 214 | 1 | A005 | 2169 |
| 450 | 1 | A006 | 6142 |
Simple random sampling
Simple random sampling is the most basic sampling method . It is divided into repeated sampling and non repeated sampling . The social survey adopts non repeated sampling .
sample(x,size,replace=FALSE,prob=NULL)
- x : Sample population
- size: Sample size
- replace: Whether it has been put back
- prob: Sampling probability , Default equal probability
Use sample The function sorts the data in ascending order
#  Sample the data serial number
#  Extraction without return 10 Samples
index_11 <- sample(1:nrow(data),10,replace = FALSE)
index_11
data[index_11,]
- 202
- 181
- 392
- 222
- 22
- 117
- 190
- 247
- 135
- 169
| major | ID | income | |
|---|---|---|---|
| 65 | 2 | B102 | 8522 |
| 369 | 2 | B081 | 8386 |
| 309 | 3 | C092 | 6151 |
| 169 | 2 | B122 | 6439 |
| 392 | 1 | A022 | 4371 |
| 41 | 2 | B017 | 4203 |
| 428 | 2 | B090 | 5392 |
| 44 | 2 | B147 | 3291 |
| 402 | 2 | B035 | 7097 |
| 523 | 2 | B069 | 8141 |
#  The withdrawal income returned is greater than 6000 Of 5 Samples
index_12 <- sample(data$ID,5,replace = TRUE)
index_12
- C118
- A006
- B117
- B104
- C087
#  Random sampling with unequal probability
sample(c("a","b","c"),size = 10,replace = TRUE,
       prob = c(0.1,0.5,0.4))
- 'c'
- 'c'
- 'b'
- 'c'
- 'b'
- 'b'
- 'b'
- 'a'
- 'c'
- 'b'
Stratified sampling
Stratified sampling : First, the population is divided into several sub populations according to one or several characteristics , Each sub population is called a layer ; Then several sub samples are randomly selected from each layer , These sub samples together are the samples of the population
strata(data, stratanames=NULL, size, method=c(“srswor”,“srswr”,“poisson”,“systematic”), pik,description=FALSE)
- stratanames: Hierarchical fields
- size: Sample size of each layer
- method:
- srswor: Don't put back the random sample
- srswr: Put back the random sample
- poisson: Poisson sampling
- systematic: Systematic sampling
- pik: The probability that each data is included in the sample , Only used in unequal probability sampling
- description: TRUE when , Display the number of samples and the total number
#  Import sampling
library(sampling)

#  Stratified sampling by discipline , Each extraction 1 individual ,2 individual ,3 individual , The method is to sample without putting it back , Display description information
index_21 <- strata(data,stratanames = " major ",size=c(1,2,3),
                   method = "srswor",description = TRUE)
index_21
Stratum 1

Population total and number of selected units: 100 1
Stratum 2

Population total and number of selected units: 200 2
Stratum 3

Population total and number of selected units: 300 3
Number of strata  3
Total number of selected units 6
| major | ID_unit | Prob | Stratum | |
|---|---|---|---|---|
| 62 | 1 | 62 | 0.01 | 1 |
| 241 | 2 | 241 | 0.01 | 2 |
| 280 | 2 | 280 | 0.01 | 2 |
| 359 | 3 | 359 | 0.01 | 3 |
| 393 | 3 | 393 | 0.01 | 3 |
| 399 | 3 | 399 | 0.01 | 3 |
Systematic sampling
Also known as equidistant sampling . It is a variant of pure random sampling . In systematic sampling , First, change the whole from 1~N Serial numbers , And calculate the sampling distance K=N/n. In style N Is the total number of total units ,n Is sample size . And then in 1~K Take a random number from the list k1, As the first unit of the sample , Then take k1+K,k1+2K……, Until you smoke enough n Units .
Systematic sampling shall prevent periodic deviation , Because it will reduce the representativeness of the sample . for example , The list of military personnel is usually arranged by shift ,10 Class one , The monitor is No 1 name , If the sampling distance is also taken as 10 when , Then the sample is composed of soldiers or squad leaders .
data2=rbind(matrix(rep("nc",165),165,1,byrow=TRUE),
matrix(rep("sc",70),70,1,byrow=TRUE))
data2=cbind.data.frame(data2,c(rep(1,100), rep(2,50), rep(3,15), rep(1,30),rep(2,40)),
1000*runif(235))
names(data2)=c("state","region","income")

#  Use “income” Field to calculate the sampling probability of each population unit
pik=inclusionprobabilities(data2$income,10)
#  Use systematic sampling to take samples ( The sample size is 10)
s=UPsystematic(pik)
#  Extract observed data
getdata(data2,s)
| ID_unit | state | region | income | |
|---|---|---|---|---|
| 14 | 14 | nc | 1 | 172.0453 |
| 38 | 38 | nc | 1 | 341.7052 |
| 59 | 59 | nc | 1 | 616.9244 |
| 87 | 87 | nc | 1 | 331.2421 |
| 107 | 107 | nc | 2 | 150.9538 |
| 127 | 127 | nc | 2 | 993.4834 |
| 152 | 152 | nc | 3 | 992.7680 |
| 179 | 179 | sc | 1 | 854.8830 |
| 201 | 201 | sc | 2 | 638.2734 |
| 222 | 222 | sc | 2 | 919.4055 |
Describe statistics
Sometimes we just want to quickly browse the descriptive statistical characteristics of the data , If the calculation of one input function is very troublesome ,R Many functions are provided in , Multiple statistics can be displayed at once
summary function
summary() Is a function of the system itself , Include minimum and maximum values , Median , The median , Frequency statistics of quartile and category data .
vars <- c("mpg","hp","wt")
summary(mtcars[vars])
      mpg              hp              wt
 Min.   :10.40   Min.   : 52.0   Min.   :1.513
 1st Qu.:15.43   1st Qu.: 96.5   1st Qu.:2.581
 Median :19.20   Median :123.0   Median :3.325
 Mean   :20.09   Mean   :146.7   Mean   :3.217
 3rd Qu.:22.80   3rd Qu.:180.0   3rd Qu.:3.610
 Max.   :33.90   Max.   :335.0   Max.   :5.424
Hmisc In bag describe function
This function provides the number of variables and observations , Number of missing values , Number of unique values , Average , Each quantile value , Five maximum and minimum values .
library(Hmisc)
describe(mtcars[vars])
mtcars[vars]

 3  Variables      32  Observations
--------------------------------------------------------------------------------
mpg
       n  missing distinct     Info     Mean      Gmd      .05      .10
      32        0       25    0.999    20.09    6.796    12.00    14.34
     .25      .50      .75      .90      .95
   15.43    19.20    22.80    30.09    31.30

lowest : 10.4 13.3 14.3 14.7 15.0, highest: 26.0 27.3 30.4 32.4 33.9
--------------------------------------------------------------------------------
hp
       n  missing distinct     Info     Mean      Gmd      .05      .10
      32        0       22    0.997    146.7    77.04    63.65    66.00
     .25      .50      .75      .90      .95
   96.50   123.00   180.00   243.50   253.55

lowest :  52  62  65  66  91, highest: 215 230 245 264 335
--------------------------------------------------------------------------------
wt
       n  missing distinct     Info     Mean      Gmd      .05      .10
      32        0       29    0.999    3.217    1.089    1.736    1.956
     .25      .50      .75      .90      .95
   2.581    3.325    3.610    4.048    5.293

lowest : 1.513 1.615 1.835 1.935 2.140, highest: 3.845 4.070 5.250 5.345 5.424
--------------------------------------------------------------------------------
pastecs In bag stat.desc function
This function can calculate a wide variety of descriptive statistics .
stat.desc(x,basic=TRUE,desc=TRUE,norm=FALSE,p=0.95)
- basic: Calculate all the values , control , The number of missing values , And min max , Range and sum .
- desc: Calculate the median , Average , Standard error of mean value , The confidence of the mean value is 95% The confidence interval of , variance , Standard deviation and coefficient of variation
- norm: Returns the normal distribution statistic ( skewness , kurtosis , Statistical significance ) and shapiro-Wilk Normal test results
- p: confidence interval
library(pastecs)
stat.desc(mtcars[vars],norm = TRUE)
| mpg | hp | wt | |
|---|---|---|---|
| nbr.val | 32.0000000 | 32.00000000 | 32.00000000 |
| nbr.null | 0.0000000 | 0.00000000 | 0.00000000 |
| nbr.na | 0.0000000 | 0.00000000 | 0.00000000 |
| min | 10.4000000 | 52.00000000 | 1.51300000 |
| max | 33.9000000 | 335.00000000 | 5.42400000 |
| range | 23.5000000 | 283.00000000 | 3.91100000 |
| sum | 642.9000000 | 4694.00000000 | 102.95200000 |
| median | 19.2000000 | 123.00000000 | 3.32500000 |
| mean | 20.0906250 | 146.68750000 | 3.21725000 |
| SE.mean | 1.0654240 | 12.12031731 | 0.17296847 |
| CI.mean.0.95 | 2.1729465 | 24.71955013 | 0.35277153 |
| var | 36.3241028 | 4700.86693548 | 0.95737897 |
| std.dev | 6.0269481 | 68.56286849 | 0.97845744 |
| coef.var | 0.2999881 | 0.46740771 | 0.30412851 |
| skewness | 0.6106550 | 0.72602366 | 0.42314646 |
| skew.2SE | 0.7366922 | 0.87587259 | 0.51048252 |
| kurtosis | -0.3727660 | -0.13555112 | -0.02271075 |
| kurt.2SE | -0.2302812 | -0.08373853 | -0.01402987 |
| normtest.W | 0.9475647 | 0.93341934 | 0.94325772 |
| normtest.p | 0.1228814 | 0.04880824 | 0.09265499 |
All in all ,R There are many descriptive statistical functions in , These are just a few of them . Those who are interested can explore , Find your habit and use one
Welcome to my official account In the data 261 Number , My articles will be published simultaneously to the official account , And is there any resource sharing
边栏推荐
猜你喜欢

From 408 to independent proposition, 211 to postgraduate entrance examination of Guizhou University

Iterator failure condition
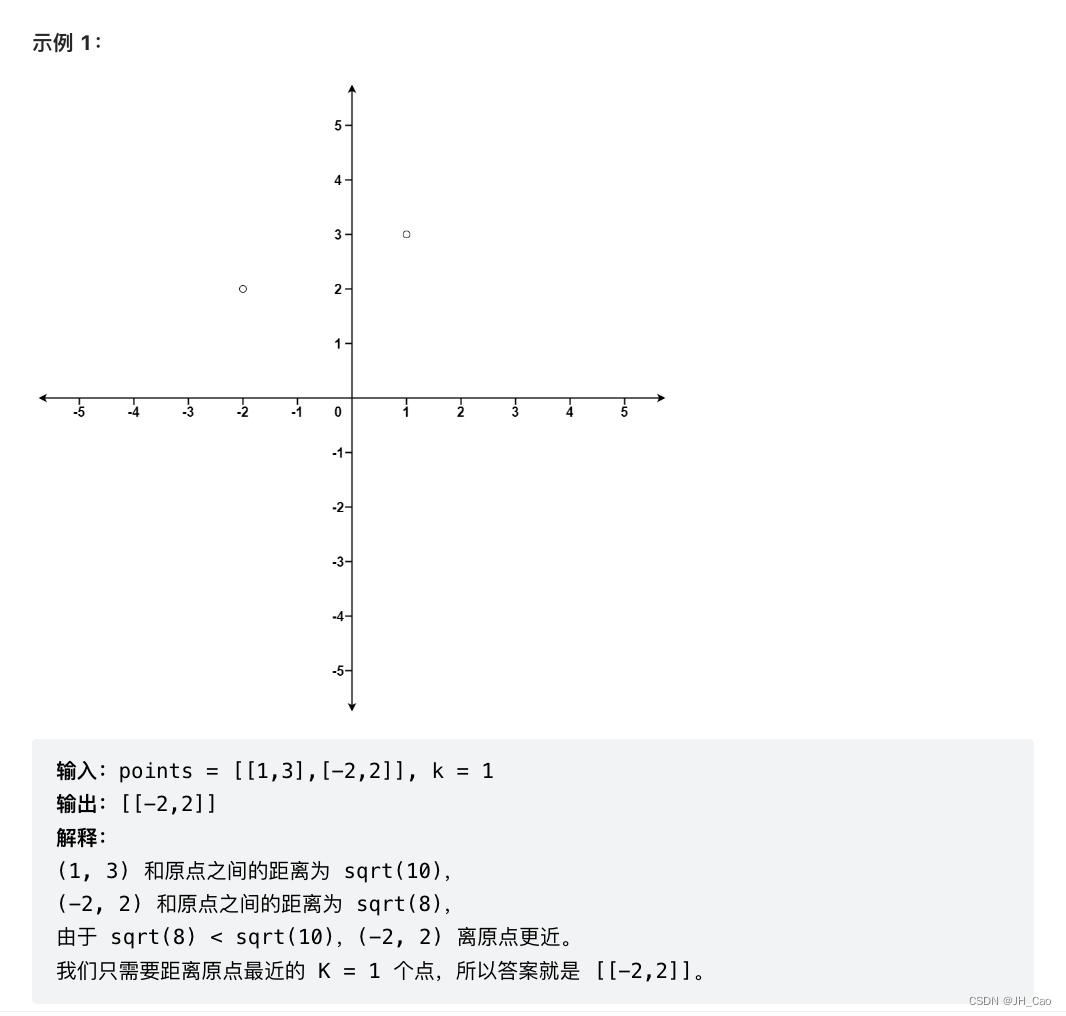
15 -- 最接近原点的 K 个点

System Verilog - thread
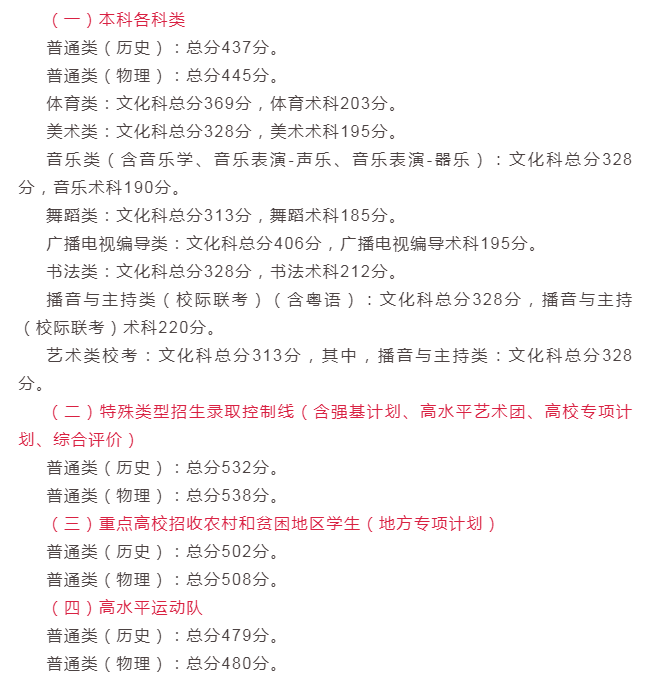
In 2022, the score line of Guangdong college entrance examination was released, and several families were happy and several worried

Review of arrays and pointers triggered by a topic

弹性布局(display:flex;)属性详解

QQ love talk candy love talk content acquisition and storage

QT source code online view

QT excel table read / write library - qtxlsx
随机推荐
Learning C language today is the first time to learn C language. In college, C linguistics is not good, but I want to make progress, so I found a beep video on the Internet to learn C language
有哪个瞬间让你觉得这个世界出bug了?
User defined data type - structure
Qlogsystem log system configuration use
14 -- 验证回文字符串 Ⅱ
[C language] implementation of magic square array (the most complete)
如何裁剪动图大小?试试这个在线照片裁剪工具
Installing QT plug-in in Visual Studio
Common dynamic memory errors
dev/mapper的解释
Time stamp calculation and audio-visual synchronization of TS stream combined video by ffmpeg protocol concat
弹性布局(display:flex;)属性详解
Afterword of Parl intensive learning 7-day punch in camp
In 2022, the score line of Guangdong college entrance examination was released, and several families were happy and several worried
Ubuntu 20.04 installing mysql8.0 and modifying the MySQL password
Design and implementation of thread pool
QT database connection
Daily question, magic square simulation
How to make GIF animation online? Try this GIF online production tool
Compile Caffe's project using cmake