当前位置:网站首页>visdom画多条动态损失曲线
visdom画多条动态损失曲线
2022-06-23 03:58:00 【andrew P】
from visdom import Visdom
from  time import sleep


'''

以这三条曲线为例:
y = 80*x
y = x**2
y = -100*x-100

'''

viz = Visdom()
x = []
Yn =[]

opts1 = {
    "title": 'chart example1',
    "xlabel":'x',
    "ylabel":'y',
    "width":500,
    "height":300,
    "legend":['b','c','d']
}
opts2 = {
    "title": 'chart example2',
    "xlabel":'x',
    "ylabel":'y',
    "width":500,
    "height":300,
    "legend":['b','c','d']
}
for i in range(1000):
    x.append(i)
    Yn.append([i*80, i**2, -i*100-100])

    ##方式一,replace
    viz.line(X=x, Y=Yn, win='chart1',env='dynamic', opts=opts1)

    ##方式二,append
    viz.line(X=[i], Y=[[i * 80, i ** 2, -i * 100 - 100]], win='chart2', env='dynamic',update='append',
             opts=opts2)
    sleep(0.01)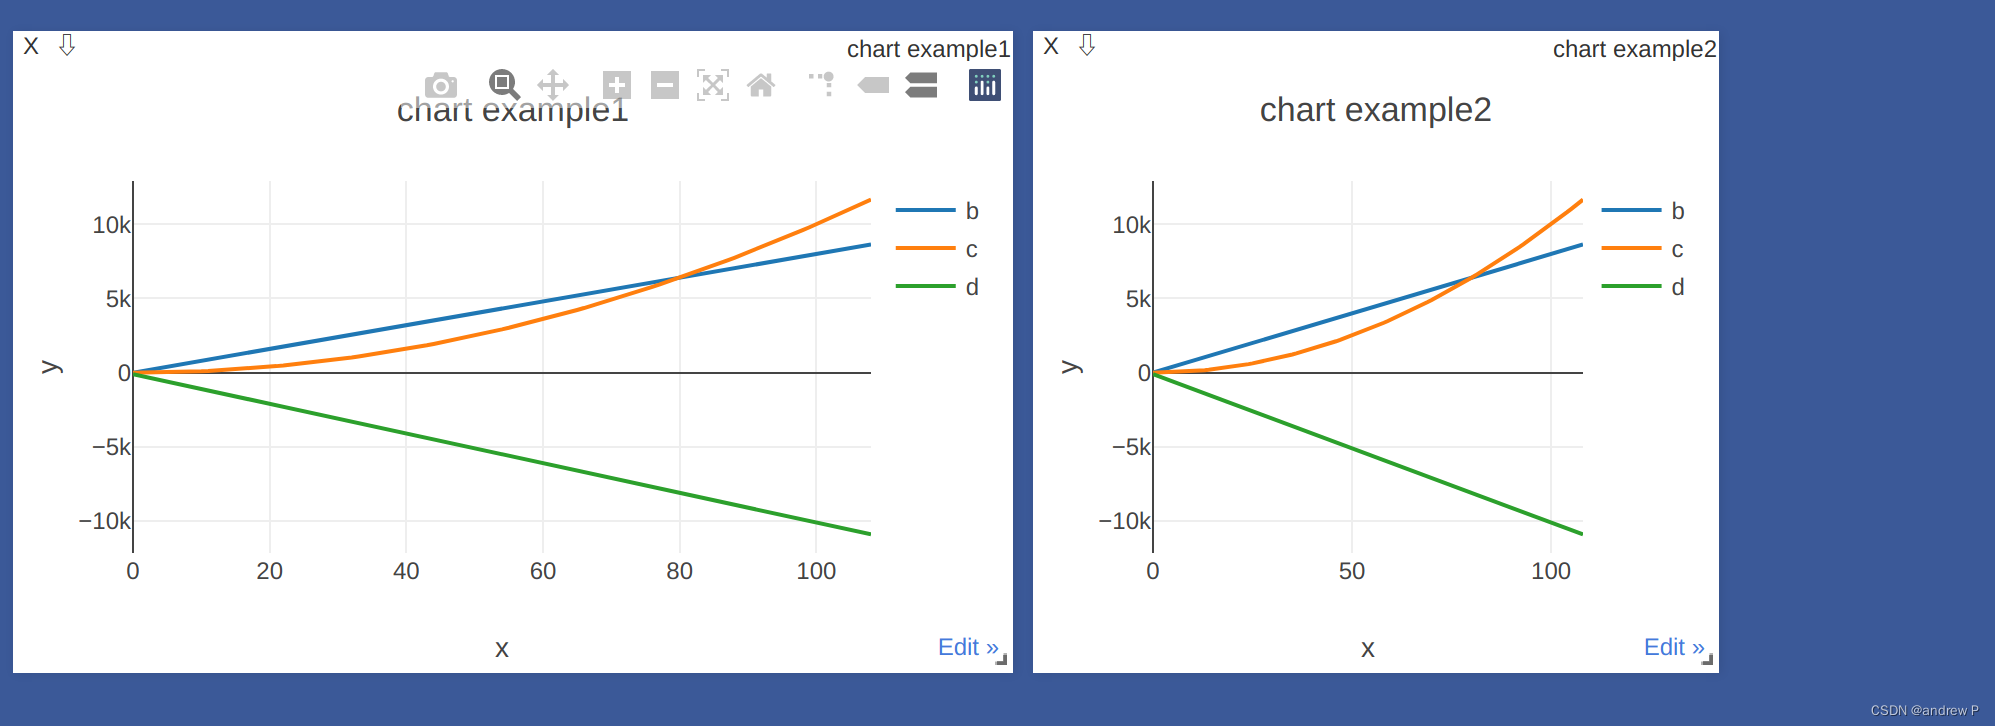
边栏推荐
- 数据库连接异常:create connection error, url: jdbc:mysql://ip/数据库名, errorCode 0, state 08S01问题处理
- Win11不能录制音频怎么办?Win11无法录入声音的解决方法
- MCS:连续随机变量——LogNormal分布
- JDBC入门学习(四)之Druid连接池的使用
- What do Niu B programmers pay attention to when "creating an index"?
- Fs2119a Synchronous Boost IC output 3.3V and fs2119b Synchronous Boost IC output 5V
- Three implementation methods: left fixed and right adaptive (Flex, float + BFC, float margin left)
- MCS:离散随机变量
- Qt QWidget嵌套相对位置获取 (qt 画线 嵌套)
- 云原生大趋势下的容器化技术现状与发展
猜你喜欢

JDBC入门学习(二)之封装工具类

FS4059A与FS5080E充电芯片的区别

MCS:连续随机变量——Chi-Square分布

Facing new challenges and becoming a better self -- an advanced technology er
Pkav simple blasting

Cloud native architecture (04) -cncf

Win软件 - (Net-Framework)已处理证书链,但是在不受信任提供程序信任的根证书中终止

Win11应用商店一直转圈解决办法

2022年中国重卡智能化升级专题研究

How much disk IO will actually occur for a byte of the read file?
随机推荐
Leetcode 797: all possible paths
抽奖 ddd 代码
MySQL自定义序列数的实现
FS4059A与FS5080E充电芯片的区别
konva 系列教程 1:konva 是什么?
ES6的Array.from方法创建长度为N的undefined数组
Shutdown shutdown command
Database connection exception: create connection error, url: jdbc: mysql://ip/ Database name, errorcode 0, state 08s01 problem handling
51万奖池邀你参战——第二届阿里云ECS CloudBuild开发者大赛来袭
Win11 app store keeps turning around solution
关于信息泄露和防御
Common wireless charging and transmitting IC chips
JDBC入门学习(二)之封装工具类
The weak are as irritable as tigers, the strong are as calm as water, and the really powerful have already given up their emotions
hash---------history
Xa mode explanation and code implementation of four Seata modes
Export PDF with watermark
1010 Radix
Win软件 - (Net-Framework)已处理证书链,但是在不受信任提供程序信任的根证书中终止
Cloud native database is the world of future databases