当前位置:网站首页>Clickhouse notes 03-- grafana accesses Clickhouse
Clickhouse notes 03-- grafana accesses Clickhouse
2022-07-25 12:40:00 【Xin Guang XG】
clickhouse note 03-- Grafana Access ClickHouse
1 Introduce
Grafana Have strong chart panel display ability , Use Grafana After that, users can create 、 Explore and share all data . If you need to pass Grafana Search Warrior ClickHouse data , You need to install a plug-in to connect ClickHouse, And then you can use it ClickHouse data .
This article mainly introduces how to do it in ClickHouse Install plug-ins in and connect ClickHouse data , And pass grafana To show the data in the table .
2 Install the test
precondition :
You can refer to clickhouse note 01– Rapid deployment clickhouse To install a set ClickHouse
You can refer to k8s note 12–grafana Configuration and common use of To quickly deploy a set grafana
- find & install ClickHouse
Server Admin->Plugins -> Search for ClickHouse , then install that will do

- Data source add clickhouse
Fill in as needed url port and The account number and password are ok

- Generate charts based on data
newly build Pannel,Data source choice CK-local,Query Type choice SQL Editor, Enter the following sql The following chart can be seen from the query statementSELECT county, count(county) as count FROM uk_price_paid2 group by county order by count desc LIMIT 10;
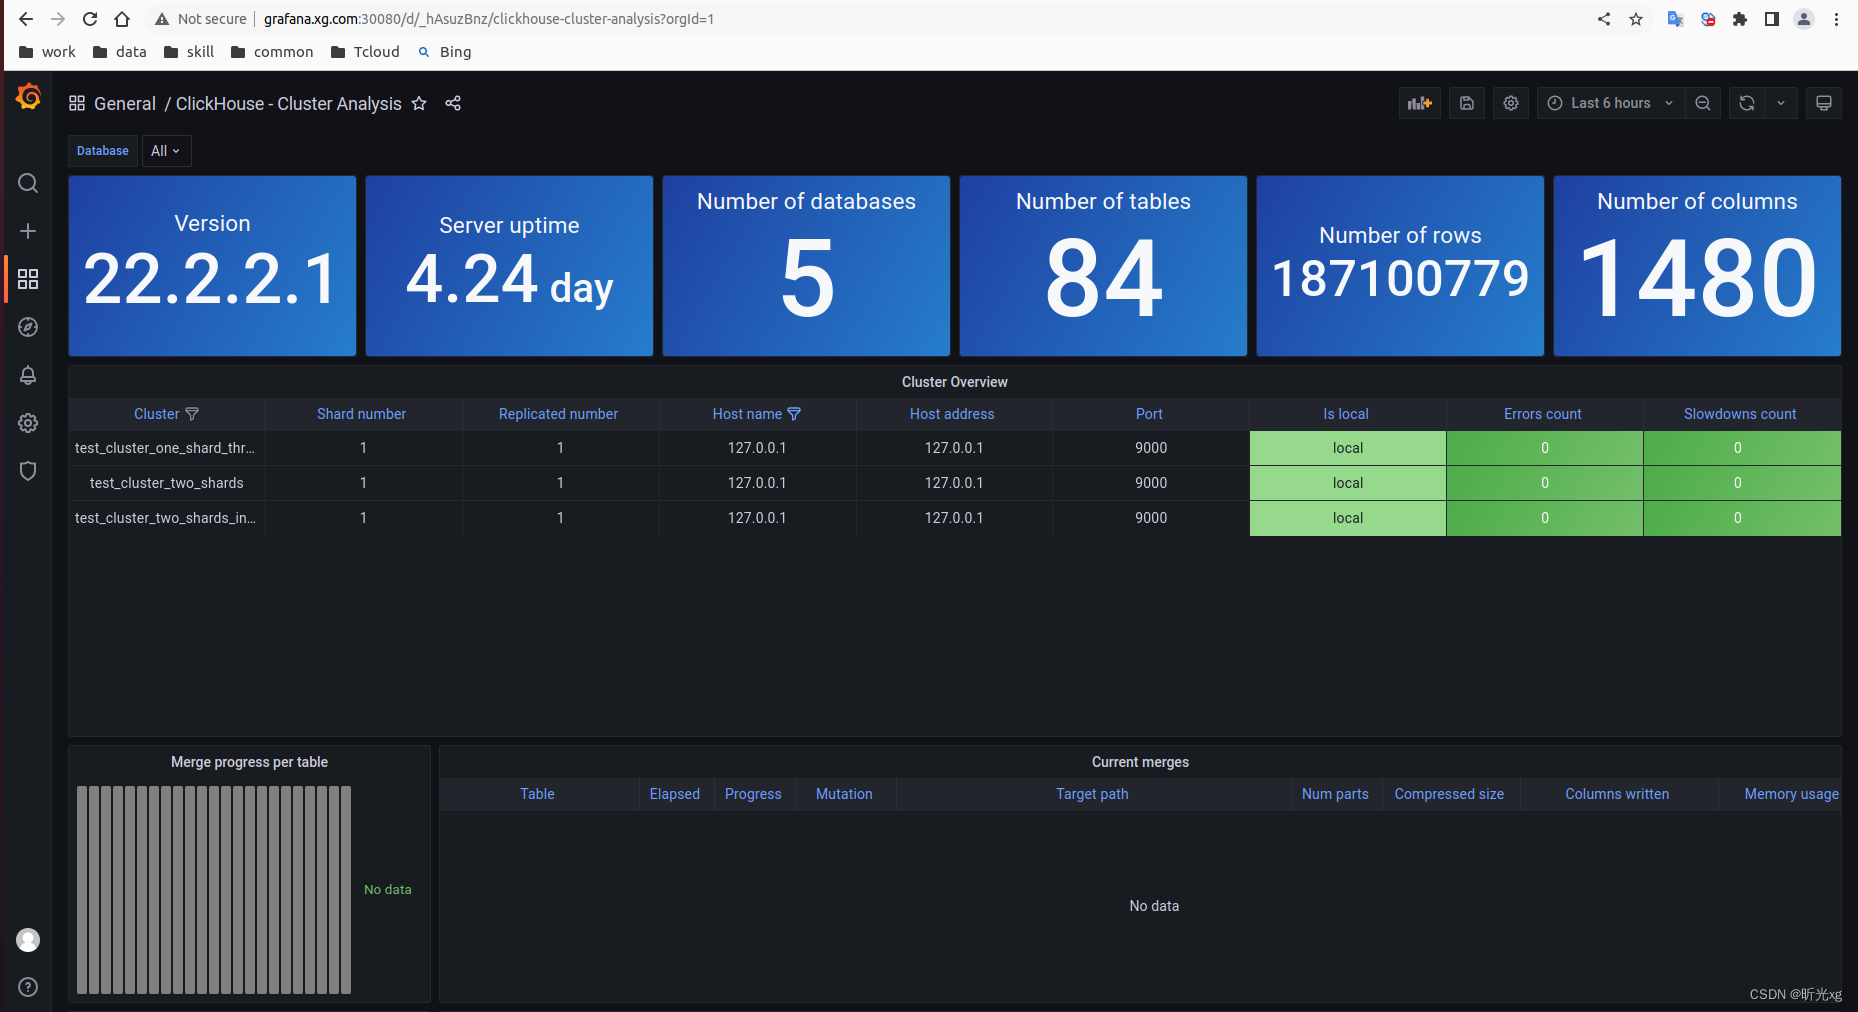
3 Monitoring clusters
Recently, I read the articles of netizens Grafana Realization clickhouse monitor (linux+mac+windows Detailed explanation of three platforms ) Discover that you can quickly monitor ClickHouse colony , Then I tested , The effect is really good , Then post the core steps in this section , So that we can learn later
- download dashboard grafana-clickhouse-datasource/versions/1.1.2/download?os=linux&arch=amd64 or grafana-clickhouse-datasource/versions/1.1.2/download?os=linux&arch=arm64
- Unpack and import to grafana, Then you can see the corresponding monitoring panel , As shown in the figure below :
cluster-analysis.json
data-analysis.json
query-analysis.json


4 matters needing attention
- Grafana Required in sql Inquire about , Need familiarity sql Basic usage , Not suitable for non developers .
5 explain
Software environment :
ClickHouse 22.2.2.1
Grafana v8.5.2
Reference documents :
Connecting Grafana to ClickHouse
clickhouse note 01– Rapid deployment clickhouse
k8s note 12–grafana Configuration and common use of
Grafana Realization clickhouse monitor (linux+mac+windows Detailed explanation of three platforms )
边栏推荐
- 交换机链路聚合详解【华为eNSP】
- cmake 学习使用笔记(二)库的生成与使用
- Synergetic process
- Script set random user_ agent
- Pytorch project practice - fashionmnist fashion classification
- mysql实现一张表数据插入另一张表
- R language ggplot2 visualization: use the ggstripchart function of ggpubr package to visualize the dot strip chart, set the palette parameter to configure the color of data points at different levels,
- Pairwise comparison of whether the mean values between R language groups are the same: pairwise hypothesis test of the mean values of multiple grouped data is performed using pairwise.t.test function
- [advanced C language] dynamic memory management
- 2022.07.24(LC_6126_设计食物评分系统)
猜你喜欢


随机推荐
Fiddler抓包APP
Detailed explanation of flex box
技术管理杂谈
Visualize the training process using tensorboard
【C语言进阶】动态内存管理
Ecological profile of pytorch
Introduction to the scratch crawler framework
Script set random user_ agent
Use of hystrix
循环创建目录与子目录
【ROS进阶篇】第九讲 URDF的编程优化Xacro使用
Cmake learning notes (II) generation and use of Library
搭建Vision Transformer系列实践,终于见面了,Timm库!
Implementation of recommendation system collaborative filtering in spark
Spirng @Conditional 条件注解的使用
Crawler crawls dynamic website
JS convert pseudo array to array
微软Azure和易观分析联合发布《企业级云原生平台驱动数字化转型》报告
PyTorch项目实战—FashionMNIST时装分类
R language uses LM function to build multiple linear regression model, step function to build forward stepwise regression model to screen the best subset of prediction variables, and scope parameter t