当前位置:网站首页>Mapstacks: data normalization and layered color layer loading
Mapstacks: data normalization and layered color layer loading
2022-06-24 20:33:00 【I don't seem to know you】
functional requirement
In the process of map function development , There are statistical values based on zoning , Realize the requirements of layered color setting . Such as : The following population statistics are available ( among AREA Indicates the administrative division code ,POPDENSITY Represents the total population ), Now we need to calculate the total population , Realize layered color setting , To visually display the spatial distribution characteristics of population .
{

    "msg": " Return to success ",
    "data": [
        {
     "AREA": "310101", "POPDENSITY": 32295 },
        {
     "AREA": "310104", "POPDENSITY": 20177 },
        {
     "AREA": "310105", "POPDENSITY": 18651 },
        {
     "AREA": "310106", "POPDENSITY": 26533 },
        {
     "AREA": "310107", "POPDENSITY": 22325 },
        {
     "AREA": "310109", "POPDENSITY": 32387 },
        {
     "AREA": "310110", "POPDENSITY": 20517 },
        {
     "AREA": "310112", "POPDENSITY": 7115 },
        {
     "AREA": "310113", "POPDENSITY": 7407 },
        {
     "AREA": "310114", "POPDENSITY": 3960 },
        {
     "AREA": "310115", "POPDENSITY": 4071 },
        {
     "AREA": "310116", "POPDENSITY": 1356 },
        {
     "AREA": "310117", "POPDENSITY": 3158 },
        {
     "AREA": "310118", "POPDENSITY": 1902 },
        {
     "AREA": "310120", "POPDENSITY": 1597 },
        {
     "AREA": "310151", "POPDENSITY": 470 }
    ]
}
Realize the idea
Ribbon selection
Color in layers , In essence, it is based on different weight values , To select the quantity value of different weight levels , By changing the color , To reflect the change of the value . Map to geospatial , It is to show the change of numerical value in spatial distribution . How to choose the ribbon ? Sure Click here to , adopt Color Blender Online tool generation . Here are the ribbons I designed , The corresponding color code array is as follows , The length is 10,
  const colortable_3 = [
            "#FFFFCC",
            "#FFF1B9",
            "#FFE3A7",
            "#FFD594",
            "#FFC782",
            "#FFB96F",
            "#FFAC5D",
            "#FF9E4A",
            "#FF9038",
            "#FF8225",
            "#FF7413",
            "#FF6600"
        ]

Data processing
How to map statistical data to color space ? Because the ribbon array length is 10, therefore , The original data can be normalized first , Then multiply the processing result by 10, Rounding down , Take the calculation result as colortable_3 Index value of the array , I'm going to take the corresponding 16 Base color code .
Through the above normalization 、 Rescaling processing , The change of the original data can be mapped to the color change of the color space .
The calculation formula is as follows ,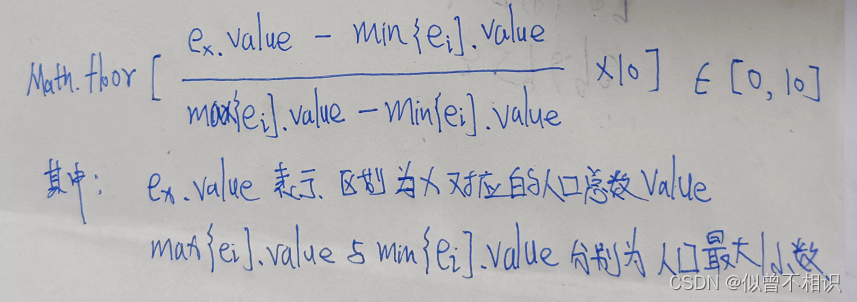
Core code
Corresponding core computing code , The implementation is as follows ,
  /** *  Load the administrative division map of Shanghai - Color map of population density stratification  * */
    function loadSH_map(_map, _layerName, _dataSource, _boundValue, _colorTable = colortable_1) {

        let collection = new Array();
        //  Traverse _dataSource data source - To reset symbol Property value
        _dataSource.some(function(value, index, array) {

            // Get the administrative division code
            let code = value.properties.adcode;
            // according to code Get the corresponding NUM value
            let curValue = getValueByAreaCode(code, _boundValue);
            // Calculate the normalized value - Integer values
            let normalizationValue = Math.floor((curValue.POPDENSITY - _boundValue.min.POPDENSITY) / (_boundValue.max.POPDENSITY - _boundValue.min.POPDENSITY) * (_colorTable.length - 1));
            console.log(normalizationValue)
                // Get color table values
            let fillColor = _colorTable[normalizationValue];
            // Get the coordinate array
            let coordinates = value.geometry.coordinates;
            console.log(coordinates)
                // structure polygon Polygon object
            let polygon = new maptalks.MultiPolygon(coordinates, {

                visible: true,
                editable: true,
                cursor: 'pointer',
                shadowBlur: 0,
                shadowColor: 'black',
                draggable: false,
                dragShadow: false, // display a shadow during dragging
                drawOnAxis: null, // force dragging stick on a axis, can be: x, y
                symbol: {

                    'lineColor': '#34495e',
                    'lineWidth': 2,
                    'polygonFill': fillColor,
                    'polygonOpacity': 1
                }
            });
            collection.push(polygon);
        })
        new maptalks.VectorLayer('vector', new maptalks.GeometryCollection(collection))
            .addTo(_map);

    }

    /** *  Obtain the corresponding... According to the administrative division code NUM value  * */
    function getValueByAreaCode(_code, _boundValue) {

        let result = boundValue.min;
        for (let i = 0; i < polulation.length; i++)
            if (polulation[i].AREA == _code) {

                result = polulation[i];
                break;
            }
        return result;
    }
Complete sample code
The following is the complete code implementation , How to visualize geographical space ? Here it is , choose maptalks Two dimensional and three-dimensional integrated visualization platform , The sample code is as follows ,
<!DOCTYPE html>
<html lang="en">
<head>
<meta charset="UTF-8">
<meta http-equiv="X-UA-Compatible" content="IE=edge">
<meta name="viewport" content="width=device-width, initial-scale=1.0">
<title> Shanghai layered color design </title>
<!-- style inline style -->
<style type="text/css">
html,
body {
margin: 0px;
height: 100%;
width: 100%
}
.container {
width: 100%;
height: 100%;
}
/* hide maptalks Bottom text properties */
.maptalks-attribution {
display: none;
}
</style>
<!-- introduce maptalks resources -->
<link href="./plugins/maptalks.css" />
<script src="./plugins/maptalks.js"></script>
<!-- jquery -->
<script src="./plugins/jquery-3.2.1.min.js"></script>
<!-- introduce arcgis Development kit -->
<script src="./plugins/arcgis/maptalks.arcgis.min.js"></script>
</head>
<body>
<div id="map" class="container"></div>
</body>
<script>
// Create a base layer
let baseLayer = new maptalks.TileLayer('base', {
urlTemplate: 'https://{s}.basemaps.cartocdn.com/light_all/{z}/{x}/{y}.png',
subdomains: ['a', 'b', 'c', 'd'],
// attribution: '© <a href="http://osm.org">OpenStreetMap</a> contributors, © <a href="https://carto.com/">CARTO</a>',
// css filter
cssFilter: 'sepia(100%) invert(90%)',
opacity: 0.95, // TileLayer's opacity, 0-1
})
// initialization maptalks
var map = new maptalks.Map('map', {
center: [121.467, 31.0334],
zoom: 10,
minZoom: 1, // set map's min zoom to 14
maxZoom: 14, // set map's max zoom to 14
// Drag the tilt rotation parameter
//allow map to drag pitching, true by default
dragPitch: true, // Disable lifting / The camera pitch Angle switch
//allow map to drag rotating, true by default
dragRotate: true, //false- Disable rotation
//enable map to drag pitching and rotating at the same time, false by default
dragRotatePitch: true, //
doubleClickZoom: false, // Cancel the mouse double click zoom effect
baseLayer: baseLayer,
});
// Mount layer
map.configLayers = {
base_layer: baseLayer, // Base map layer
sh_layer: undefined, // Base vector layer
hhypsometric_layer: undefined, // Heat map layers
};
// color table
const colortable_3 = [
"#FFFFCC",
"#FFF1B9",
"#FFE3A7",
"#FFD594",
"#FFC782",
"#FFB96F",
"#FFAC5D",
"#FF9E4A",
"#FF9038",
"#FF8225",
"#FF7413",
"#FF6600"
]
// Access to population data + Shanghai administrative division data
let polulation = getDataSource("people_num").data;
let sh_dataSource = getDataSource("shanghai").features
let sh_textSource = getDataSource("shanghai");
// Get population boundary data
let boundValue = deal_populationData(polulation)
// load sh Administrative division data
loadSH_map(map, "sh_layer", sh_dataSource, boundValue, colortable_3);
// Text notes
initMarker(map, sh_textSource);
/** * Initialize center mark point * */
function initMarker(_map, _dataSource) {
//json To geometry
let geometries = maptalks.GeoJSON.toGeometry(_dataSource);
let shptArray = new Array();
// Traverse geometries- Add center mark point
geometries.some(function(value, index, array) {
let properties = value.properties; // Get attribute data
shptArray.push(
new maptalks.Marker(properties.center, {
id: properties.name,
visible: true,
editable: true,
cursor: 'pointer',
shadowBlur: 0,
shadowColor: 'black',
draggable: false,
dragShadow: false, // display a shadow during dragging
drawOnAxis: null, // force dragging stick on a axis, can be: x, y
symbol: {
'textFaceName': 'sans-serif',
'textName': properties.name,
'textFill': '#fffff',
'textHorizontalAlignment': 'right',
'textSize': 16
},
properties: {
altitude: 2500,
properties: properties
}
})
)
})
// establish geometryCollection aggregate
// add to marker Assemble to VectorLayer in
new maptalks.VectorLayer('vector_Marker', new maptalks.GeometryCollection(shptArray, {
})).addTo(_map);
}
/** * Load the administrative division map of Shanghai - Color map of population density stratification * */
function loadSH_map(_map, _layerName, _dataSource, _boundValue, _colorTable = colortable_1) {
let collection = new Array();
// Traverse _dataSource data source - To reset symbol Property value
_dataSource.some(function(value, index, array) {
// Get the administrative division code
let code = value.properties.adcode;
// according to code Get the corresponding NUM value
let curValue = getValueByAreaCode(code, _boundValue);
// Calculate the normalized value - Integer values
let normalizationValue = Math.floor((curValue.POPDENSITY - _boundValue.min.POPDENSITY) / (_boundValue.max.POPDENSITY - _boundValue.min.POPDENSITY) * (_colorTable.length - 1));
console.log(normalizationValue)
// Get color table values
let fillColor = _colorTable[normalizationValue];
// Get the coordinate array
let coordinates = value.geometry.coordinates;
console.log(coordinates)
// structure polygon Polygon object
let polygon = new maptalks.MultiPolygon(coordinates, {
visible: true,
editable: true,
cursor: 'pointer',
shadowBlur: 0,
shadowColor: 'black',
draggable: false,
dragShadow: false, // display a shadow during dragging
drawOnAxis: null, // force dragging stick on a axis, can be: x, y
symbol: {
'lineColor': '#34495e',
'lineWidth': 2,
'polygonFill': fillColor,
'polygonOpacity': 1
}
});
collection.push(polygon);
})
new maptalks.VectorLayer('vector', new maptalks.GeometryCollection(collection))
.addTo(_map);
}
/** * Obtain the corresponding... According to the administrative division code NUM value * */
function getValueByAreaCode(_code, _boundValue) {
let result = boundValue.min;
for (let i = 0; i < polulation.length; i++)
if (polulation[i].AREA == _code) {
result = polulation[i];
break;
}
return result;
}
// Population data processing
function deal_populationData(_population) {
let boundValue = {
};
let minTemp = _population[0],
maxTemp = _population[0];
// Calculate the maximum and minimum
_population.some(function(value, index, array) {
minTemp.POPDENSITY > value.POPDENSITY ? minTemp = value : "";
maxTemp.POPDENSITY < value.POPDENSITY ? maxTemp = value : "";
})
return boundValue = {
min: minTemp,
max: maxTemp
}
}
/** * Acquisition data source * */
function getDataSource(_dataSource) {
let dataSource = undefined;
$.ajax({
url: "./data/" + _dataSource + ".json",
method: "GET",
async: false,
success: function(result, text, xhr) {
//GeoJSON utilities-Convert one or more GeoJSON objects to geometry
dataSource = result;
}
});
return dataSource;
}
</script>
</html>
Final effect
The final display effect is as follows ,
边栏推荐
- 京东一面:Redis 如何实现库存扣减操作?如何防止商品被超卖?
- 二叉树的基本性质与遍历
- Q1: error in JMeter filename must not be null or empty
- 用自身细胞作为原料,首例3D打印耳朵移植成功!未来可打印更复杂器官
- 宅男救不了元宇宙
- Where is 5g really powerful? What is the difference with 4G?
- Todesk remote control, detailed introduction and tutorial
- OpenVINO2022 Dev Tools安装与使用
- gateway
- Popupwindow touch event transparent transmission scheme
猜你喜欢

Using dynamic time warping (DTW) to solve the similarity measurement of time series and the similarity identification analysis of pollution concentration in upstream and downstream rivers

Leetcode(135)——分发糖果

Basic properties and ergodicity of binary tree

What about the Golden Angel of thunder one? Golden Angel mission details

Bytebase 加入阿裏雲 PolarDB 開源數據庫社區

图像PANR

图的基本概念以及相关定义

Design of routing service for multi Activity Architecture Design

基于QT+MySQL的相机租赁管理系统
Microsoft Office Excel 2013 2016 graphic tutorial on how to enable macro function
随机推荐
别再用 System.currentTimeMillis() 统计耗时了,太 Low,StopWatch 好用到爆!
unity实战之lol技能释放范围
Bean lifecycle flowchart
[multi thread performance tuning] multi thread lock optimization (Part 1): optimization method of synchronized synchronization lock
基于SSM的物料管理系统(源码+文档+数据库)
CVPR 2022 remembers Sun Jian! Tongji and Ali won the best student thesis award, and hekaiming was shortlisted
gateway
Bytebase加入阿里云PolarDB开源数据库社区
Popupwindow touch event transparent transmission scheme
Sequential stack traversal binary tree
Teach you how to view the number of connected people on WiFi in detail how to view the number of connected people on WiFi
Teach you how to cancel computer hibernation
Openvino2022 dev tools installation and use
建立自己的网站(14)
Q1: error in JMeter filename must not be null or empty
Camera rental management system based on qt+mysql
Error in Android connection database query statement
16 excellent business process management tools
传统的IO存在什么问题?为什么引入零拷贝的?
RF_ DC system clock setting gen1/gen2