当前位置:网站首页>Cloud native observability tracking technology in the eyes of Baidu engineers
Cloud native observability tracking technology in the eyes of Baidu engineers
2022-07-23 15:04:00 【Baidu geek said】

author | daydreamer
One 、 The concept is introduced
In the cloud native domain , Observability refers to inferring and measuring the internal state of the system from the external output , Describe the level of understanding of what happens in the system . The three common foundations of observability are Metrics、Tracing and Logging:
Monitoring indicators (Metrics): The defining characteristics of monitoring indicators are aggregatable , It is to form a single logical indicator within a period of time 、 Atoms of counters or histograms . for example : Incoming http The number of requests can be modeled as a counter , Its update aggregation is simple addition .
track (Tracing): Its defining feature is that it processes information within the scope of the request , Any data or metadata that can be bound to the life cycle of a single transaction object in the system . for example : Actual sent to database sql The text of the query .
journal (Logging): The defining feature of a log is that it handles discrete events . for example : Application debugging or error messages are sent to the cluster for unified processing through a cuttable file .
In these three areas , Monitoring indicators often require the least resources to manage , Because in essence , they “ Compress ” It's done quite well ; Logging tends to overwhelmingly exceed the production traffic it reports . From the perspective of data volume and cost , From monitoring ( low ) To the log ( high ), Tracking technology tracing Maybe somewhere in the middle .

Of course , The significance of observability is to better serve business systems , In practice, the application is often tailored to business needs , Analyze it abstractly , You can see the functions and characteristics of several observable systems , for example , Open source prometheus The project was initially started as a monitoring system , as time goes on , It may develop in the direction of tracking , To enter the requested scope (request-scope) Monitoring in , But it probably won't go deep into the log space .
Two 、 Track technical data models ( With OpenTelemetry Standards, for example )
We use OpenTelemetry standard [1] For example , Brief introduction tracing General data model .
The classic model of tracking data originally came from Google The classic paper of [2], It defines a set of general data reporting interfaces , Each distributed tracking system is required to implement this interface , So as to adapt to various distributed tracking systems that comply with this standard , And for developers , Can be based on business needs , Switch different distributed tracking systems at will .
OpenTelemetry The trace in the standard is determined by their Span The implicit definition . especially , Can be Trace As Spans Directed acyclic graph of (DAG), among Spans The edge between is called References.
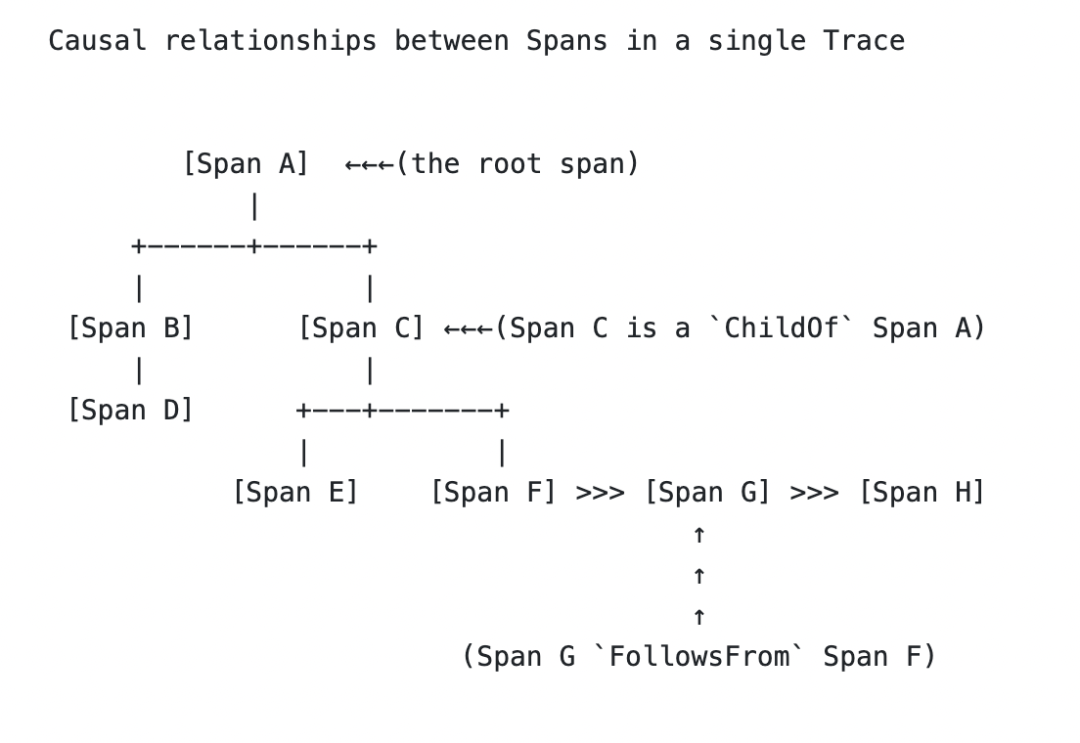
Every Span The following states are encapsulated :
Name
Start and End Timestamps
Span Context
Span context uses two identifiers to provide specific context about tracking and span :Trace ID and Span ID. Every Span By one in Trace The only one ID identification , be called Span ID.Span Use Trace ID To mark span Relationship with its tracking .Span Context To describe the relationship across service and process boundaries .
Attributes
Key value pairs containing metadata (key-value), You can use metadata to annotate Span To carry information about the operation it is tracking .
Span Events
Is considered to be Span Structured log messages on ( Or comments ), Usually used to indicate Span Meaningful single point in duration .
Span Links
You can put a span With one or more span Related to , So as to describe the upstream and downstream relationship of execution . for example , Suppose we have a distributed system , In response to some of these actions ( Call it operation a), An extra operation ( Call it operation b) Queued for execution , operation b The execution of is asynchronous . We hope to operate b And operation a Related to , But we cannot predict the operation b When to start . At this time, the operation a the last one span Link to action b first span, So as to describe their upstream and downstream relationship .
Span Status
Status code
3、 ... and 、 industry tracing to ground Uber Jaeger
Uber The company 2016 In, it opened source excellent in the field of cloud native tracing platform Jaeger[3]. At that time, the background of the project was ,Uber Facing the exponential growth of business, the number of micro services has increased , For the observability of large-scale distributed microservice architecture , There is still a lack of a perfect tracking platform . After the project is open source , Has been sought after by the industry ,2017 By the CNCF Accept as a graduation project . The platform features a single API The design of the times has changed into distributed design , Realize unified context propagation context, And the decision of sampling strategy is transferred to the tracking backend , Allow the backend to dynamically adjust the sampling rate . The platform fully supports OpenTelemetry standard , It has always been a de facto standard product in the cloud native field .
Jaeger The overall architecture of is as follows :

among jaeger-client It is a client-side collection component , Support dynamic traffic simulation , Perceptible to storage pressure .jaeger-agent Responsible for sampling related strategies .jaeger-collector be responsible for tracing Data collection , Sorting and transferring .jaeger-ui and jaeger-query Responsible for the platform UI Interaction . The access method supports middleware embedding , Support HTTP Other protocols , The underlying storage uses Cassandra,Elasticsearch And other open source storage platforms .
about Jaeger See the official website for details of :https://www.jaegertracing.io/
Alibaba eagle eye platform
Eagle eye is a new generation of log based distributed call tracking system created by Alibaba for mass traffic activities such as the double 11 . It solves the difficulty of fault location , Capacity estimation is difficult , Waste more resources , It is difficult to sort out links and other online problems . The platform has the following characteristics :
Architecture iterations are becoming lighter , Data presentation is more real-time , Upgrade from batch to streaming
Visualize the monitoring process , Reduce access costs , The construction design is handed over to the user
Sample the data according to the analysis scenario , For example, the analysis of link morphology does not require full data
The platform adopts unified log printing form and measurement standard , Hot spots and capacity estimates can be found , Support pressure measurement , Illegal traffic . Achieve global call statistics ,trace Query, real-time monitoring and other functions . Support http/tcp Such agreement , The access method supports middleware embedding , Bytecode enhancement, etc , The bottom layer uses HDFS/HBASE/HSTORE/MPP Wait to store the database . The following figure shows the global call topology of the platform .

For the introduction of the platform, please refer to Alibaba cloud's introduction article 《 Best practice in building a three-dimensional monitoring system 》.
Four 、 Difficulties encountered in actual work and solutions
In Baidu's actual production system , We also widely use tracking technology to realize real-time monitoring of the whole link 、 Traffic performance statistics and requests trace Query and case Troubleshooting and other functions . In the process of application , We also have some practical experience :
1. The amount of data tracked is large , Mainly in :
High acquisition pressure , requirement SDK High performance , Due to the decentralized reporting and transmission of requests, there is little pressure
Optimize and realize reasonable sampling strategy
Deep optimization coding and Mapping Algorithm
Data is classified according to types and usage scenarios , Choose different underlying storage
2. Access costs are very important , Need to keep costs very low . Mainly in :
Developers are not very active in accessing non business code , In this case, the interface design is simple 、 Easy to use , A large number of buried points can rely on the underlying framework , Custom burying points are easy to use
SDK Use the conciseness of documentation 、 accurate , There are good existing practice scenarios that can be reused directly
The cost performance of investment should be high , We can see the practical problems solved by the system
3. High stability requirements , The main experience is :
Use local persistence as a buffer
The combination of flow and task , Insert trick task etc.
4. The need to implement some advanced features , for example :
Confidence analysis of indicators , And data science
Real time analysis of multiple aggregation windows , Both short-term timeliness and long-term trend analysis
More intuitive display form , How to intuitively display as much information as possible with as few indicators
in general , With OpenTelemetry Standard landing , Cloud native observability tracking technology is also developing , It has also been widely used in the production environment , It strongly supports the stability of large-scale distributed microservice systems , performance , Efficiency and other aspects . We start from the perspective of a Baidu engineer , Can also see the leopard , At first sight, the breadth and depth of observability .
---------- END ----------
Reference material :
[1] OpenTelemetry:https://opentelemetry.io/docs/concepts/signals/traces/#spans-in-opentelemetry
[2] Benjamin H. Sigelman Luiz André Barroso, et. al. 2010, Dapper, a Large-Scale Distributed Systems Tracing Infrastructure
[3] Uber Jaeger:https://eng.uber.com/distributed-tracing/
Recommended reading 【 Technical gas station 】 series :
Use Baidu developer tools 4.0 Build a dedicated applet IDE
Baidu engineers teach you to play with design patterns ( Observer mode )
Uncover the practice of Baidu intelligent test in the field of automatic test execution
H.265 Introduction to coding principles
Small program startup performance optimization practice
Baidu engineers teach you to play with design patterns ( The singleton pattern )

边栏推荐
猜你喜欢

![[untitled] test [untitled] test](/img/9d/c80dd9a1df2cd6cbbfc597d73a63b2.png)


随机推荐
MySQL unique index has no duplicate value, and the error is repeated
Argocd user management, RBAC control, script login, APP synchronization
Common JS modular specification from a code question
Leetcode-227-basic calculator||
[software test] MQ abnormal test encountered in disk-to-disk work
[test platform development] XVII. The interface editing page realizes the drop-down cascade selection, and binds the module to which the interface belongs
颜值爆表 Redis官方可视化工具来啦,针不戳
Version correspondence between numpy and pytorch
基于双目相机拍摄图像的深度信息提取和目标测距matlab仿真
The accuracy of digital addition
581. Shortest unordered continuous subarray
LeetCode-227-基本计算器||
数字相加的精度问题
直播课堂系统01-数据库表设计
Liunx:浅析vim编辑器基本使用
深度学习单图三维人脸重建
cmake笔记
Postgresql快照优化Globalvis新体系分析(性能大幅增强)
Blazor quickly realizes Minesweeper
[record of question brushing] 19. Delete the penultimate node of the linked list