当前位置:网站首页>Mysqlworkbench performance analysis tool -- Performance dashboard
Mysqlworkbench performance analysis tool -- Performance dashboard
2022-07-24 18:28:00 【xiangjai】
MySQLworkbench You can display server performance statistics in a graphical dashboard . If you want to display the dashboard , Please open a database server , Then select Manage... From the left navigation ("management") tab . Then click dashboard ("dashboard").
Dashboard location

The following figure shows the information layout in the instrument cluster
Be careful This feature requires MySQL server5.6 Or higher
 Dashboard layout
Network state (Network Status)
It highlights Mysql Statistics of network traffic sent and received by the server through the client connection , Including incoming network traffic , Outgoing network traffic and number of client connections

Network state
From top to bottom is :
Number of incoming Networks (Incoming Network Traffic) Unit byte / second
Number of outgoing Networks (Outgoing Network Traffic) Unit byte / second
Number of client connections (Client connections)
MySQL state (MySQL status)
It highlights MySQL Server main activity and performance statistics . Data includes open table cache hit efficiency (MySQL How to open the table ), Executive sql sentence , as well as SELECT,INSERT,UPDATE,DELETE,CREATE,ALTER and DROP Count of statements ( Per second ).

MySQL Status
From top to bottom is
Open table cache hit rate (Table Open Cache). Mouse over for more details
sql Statement execution (SQL Statements Executed)
Various major SQL Number of statements executed
InnoDB state (InnoDB Status)
Here is provided by InnoDb Store engine generated InnoDB Overview of buffer pool and disk activity . The data is divided into three groups
Be careful
Hover over the chart to view other information , For example, total count .
- usage
- Read request (read reqs):InnoDB The number of logical read requests executed on the buffer pool ( Per second )
- Write requests (write reqs):InnoDB The number of logical write requests to the buffer pool ( Per second )
- Disk read (disk reads):InnoDB The number of times logical reads cannot be made from the buffer pool . These must be read from disk
- InnoDB Buffer pool usage (InnoDB Buffer Pool): In use InnoDB Percentage of buffer pool . Hover over to view additional information , Such as usage and idle pages (InnoDB Buffer pool )
- Write
- Written data (data written): write in InnoDB Write times of redo log file
- write in (writes): write in InnoDB The number of physical writes to redo log files
- InnoDB Disk write (InnoDB Disk Writes): Hover the mouse to view the number of disk writes in a specific second . See the last 120s
- write in (writing): from InnoDB The total amount of data written by the storage engine using file operations ( In bytes ).
- read
- Double write cache frequency (Doublewrite Buffer): Number of double cache writes performed .
- InnoDB Disk read (InnoDB Disk Reads): Hover the mouse to view the number of disk reads in a specific second . See the last 120s
Read (reading): from InnoDB The total amount of data read by the storage engine in file operations ( In bytes ).

InnoDB Status

边栏推荐
- 缺失值处理
- Pycharm configuring opencv Library
- 移动端实现0.5px的实用方案
- Some buckles
- 第五届数字中国建设峰会在福建福州开幕
- Techempower web framework performance test 21st round results release --asp Net core continue to move forward
- ORM student management system
- Go language file operation
- 【“码”力全开,“章”显实力】2022年第1季Task挑战赛贡献者榜单
- QT - animation frame
猜你喜欢
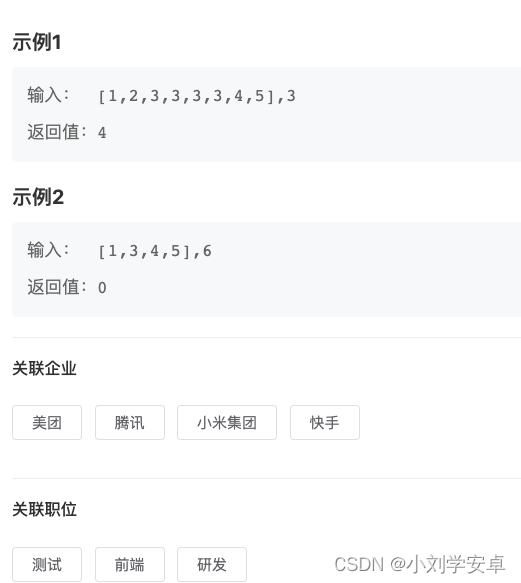
Number of times a number appears in an ascending array

Ionic4 learning notes 4 -- add a tab page
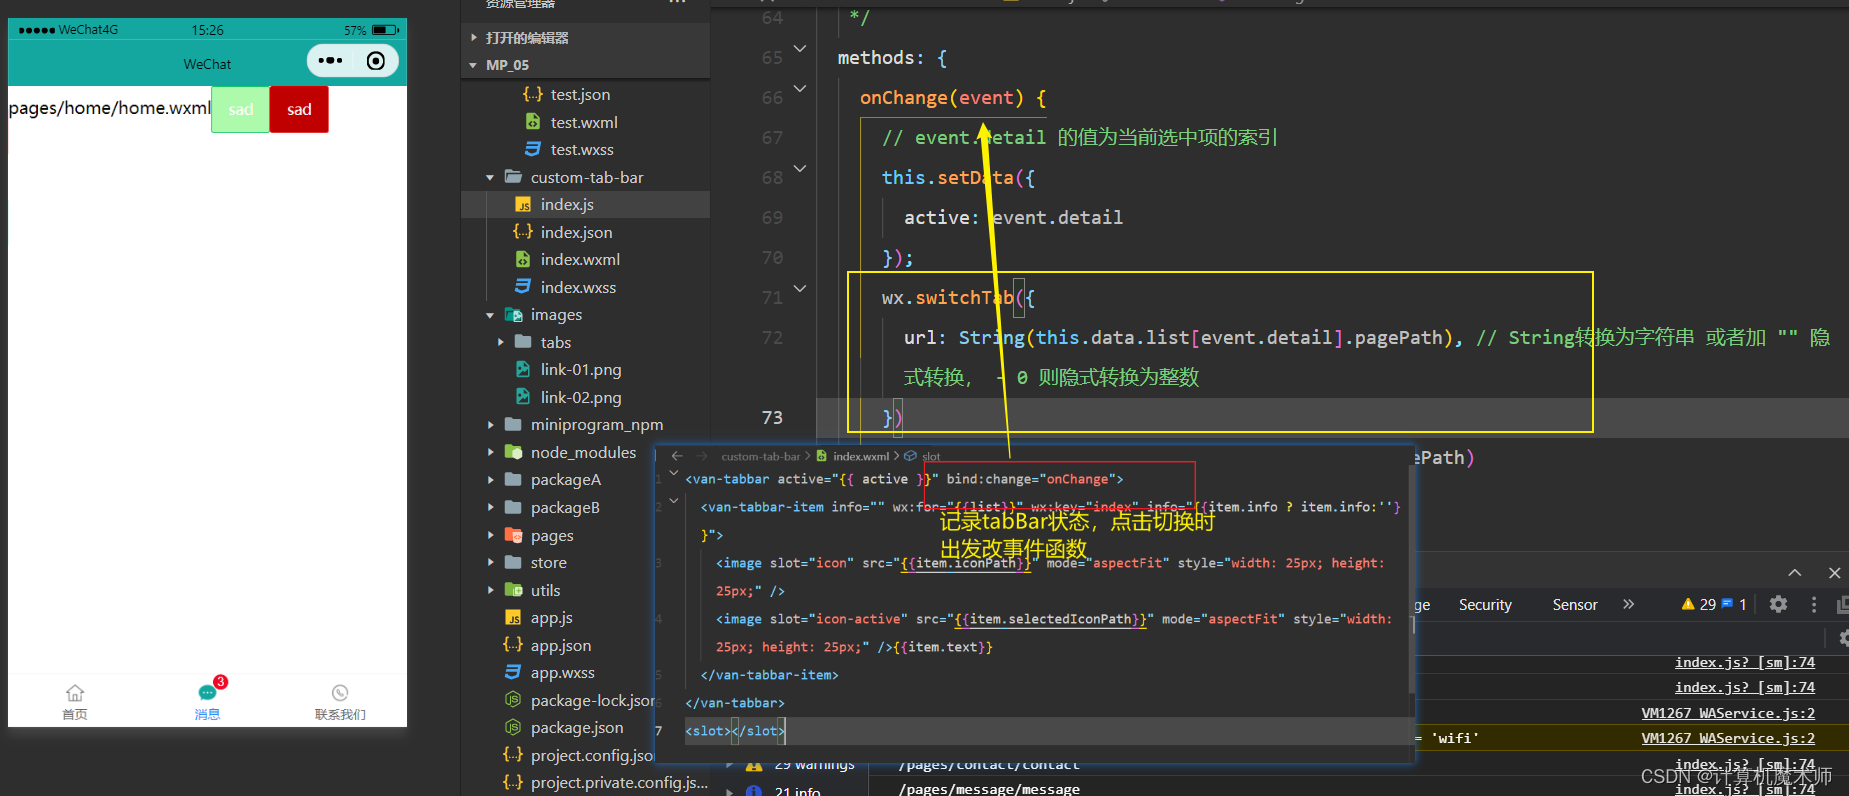
【微信小程序开发】自定义tabBar案例(定制消息99+小红心)

About the writing method of interface 1 chain interpretation 2. Method execution (finally) must be executed

Escape character in JS?

["code" power is fully open, and "chapter" shows strength] list of contributors to the task challenge in the first quarter of 2022

缺失值处理

根证书的有效期与服务器SSL证书一样长吗?

EasyUI adds row level buttons to the DataGrid

L4L7负载均衡
随机推荐
Missing value processing
数组扁平化.flat(Infinity)
Pytoch's Journey 2: gradient descent
怎么解决idea中yaml无法识别或者飘红?
2. JS variable type conversion, automatic conversion, manual conversion, what is the difference between parseint(), parsefloat(), number()?
Go language file operation
Typora is still the most beautiful and beautiful document editing artifact of yyds in my heart. I believe you will never abandon it
排序的几种方式for while 还有sort
[verification] only numbers (positive and negative numbers) can be entered
XSS绕过姿势总结
Type-C边充边听PD协议芯片
【“码”力全开,“章”显实力】2022年第1季Task挑战赛贡献者榜单
Common methods of string (2)
下拉列表组件使用 iScroll.js 实现滚动效果遇到的坑
Wechat applet reverse
Ionic4 Learning Notes 6 -- using native ionic4 components in custom components
球面上绘制圆matlab仿真
Getting started with MySQL database
The drop-down list component uses iscrol JS to achieve the rolling effect of the pit encountered
Simulation implementation vector