当前位置:网站首页>MySQL tuning -- 02 -- slow query log
MySQL tuning -- 02 -- slow query log
2022-06-25 05:49:00 【High high for loop】
Tips : When the article is finished , Directories can be generated automatically , How to generate it, please refer to the help document on the right
List of articles
Slow query log

1. Enable the slow query log parameter
1.1 Turn on slow_query_log


1.2 modify long_query_time threshold


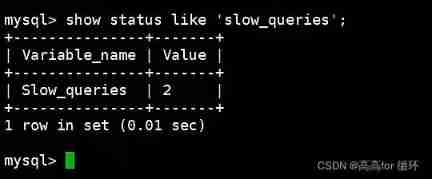
2. View the number of slow queries


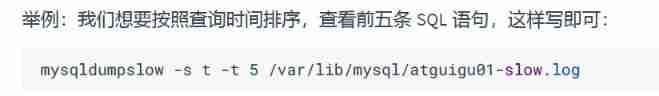
3. Slow query log analysis tool :mysqldumpslow


3.1 give an example


3.2 Common references for work :

4. Turn off slow query log
MySQL There are two ways for the server to stop the slow query log function :
The way 1: Permanent way

The way 2: Temporary way

5. Delete slow query log

Slow query case
Table structure
CREATE TABLE `person_info_large` (
    `id` BIGINT UNSIGNED NOT NULL AUTO_INCREMENT,
    `account` VARCHAR (10),
    `name` VARCHAR (20),
    `area` VARCHAR (20),
    `title` VARCHAR (20),
    `motto` VARCHAR (50),
    PRIMARY KEY (`id`),
    UNIQUE(`account`),
    KEY `index_area_title`(`area`,`title`)
) ENGINE = INNODB AUTO_INCREMENT = 1 DEFAULT CHARSET = utf8
run
- The data here is 200W strip . Note the table structure , Just remember which fields have indexes , The following analysis will focus on this table .

This 3.36s Not the actual execution time , The actual execution time has to be slow. Check the log Query_time Parameters
Slow query log files
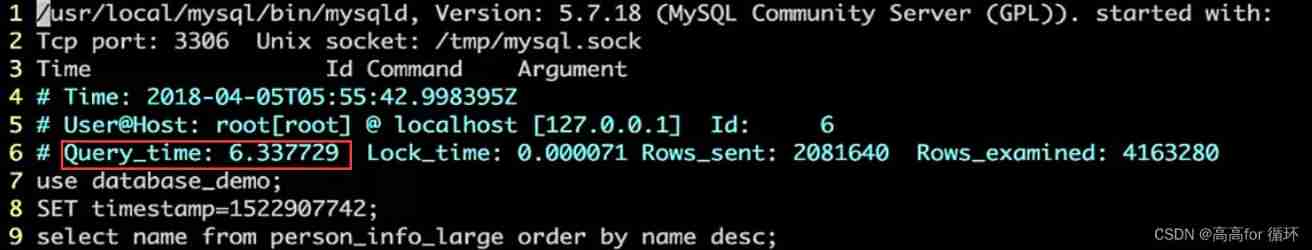
You can see Query_time: 6.337729s, More than the 1s, So it will be recorded
- Be careful : Some slow queries are executing , As a result, the database has been overloaded , However, due to the slow speed, the query has not been executed yet , Therefore, the slow query log cannot see any statements , You can use show processlist Command to view the slow query being executed .show processlist Show which threads are running , If there is PROCESS jurisdiction , You can see all threads . otherwise , You can only see the current session thread .
Parameter description
- Time: The time when the slow query occurred
- Query_time: Query time
- Lock_time: Time waiting to lock the watch
- Rows_sent: The number of rows returned by the statement
- Rows_exanined: Number of rows read from the storage engine during statement execution

concerns


Focus on : Rows_exanined Number of scanning lines / Rows_sent Returns the number of rows
边栏推荐
- Pat 1045 quick sort
- Duplicate symbols for architecture i386 clang
- Oracle SQL statement operand: rounding, rounding, differentiation and formatting
- Day13 (inner class, anonymous inner class, API common class)
- Technology inventory: Technology Evolution and Future Trend Outlook of cloud native Middleware
- Example of dynamic programming 3 leetcode 55
- SAP ui5 application development tutorial 32 - how to create a custom SAP ui5 control
- SAP Fiori tools and corresponding cli (command line interface)
- Day16 (regular expression, enumeration)
- Volatile and JMM memory models
猜你喜欢

Mirror image of binary tree
The locally developed SAP ui5 application is deployed to the ABAP server to perform error analysis

3.2.3 use tcpdump to observe TCP header information (supplement common knowledge of TCP protocol)

Excel splits a worksheet into multiple worksheets according to conditions, and how to split multiple worksheets into independent tables

Array and simple function encapsulation cases
Technology inventory: Technology Evolution and Future Trend Outlook of cloud native Middleware
Learn the interface test, see it is very good, and make a note

Example of dynamic programming 3 leetcode 55

Incorrect dependency of POM file
Trial version of routing history and routing back and history of SAP ui5


随机推荐
Day16 (regular expression, enumeration)
Jz-066- motion range of robot
3.2.3 use tcpdump to observe TCP header information (supplement common knowledge of TCP protocol)
Day18 (set, generic, hash table, tree, stack and queue, graph, array and linked list)
C language - minesweeping
Multithreading and thread pool
Learn the interface test, see it is very good, and make a note
Duplicate symbols for architecture i386 clang
The locally developed SAP ui5 application is deployed to the ABAP server to perform error analysis
Which securities company is good for opening a mobile account? Is it safe to open a mobile account?
Create a complete binary tree in array order
Interface learning
BUUCTF(web:1-50)
DOM proficient? What is the difference between node and elment?
[untitled]
Vscode voice notes to enrich information (medium)
[QT] for multithreaded programs, do not use the printf() function to print out
Japanese fifty tone diagram
Part 33 of SAP ui5 application development tutorial - trial version of responsiveness of SAP ui5 applications
Day17 (set)