当前位置:网站首页>零基础学习CANoe Panel(15)—— 文本输出(CAPL Output View )
零基础学习CANoe Panel(15)—— 文本输出(CAPL Output View )
2022-07-25 12:25:00 【蚂蚁小兵】
- 我是蚂蚁小兵,专注于车载诊断领域,尤其擅长于对CANoe工具的使用
- 寻找组织 ,答疑解惑,摸鱼聊天,博客源码,点击加入【相亲相爱一家人】
- 零基础学习CANoe Panel设计目录汇总,点击跳转
前言
前面已经讲解过
Hex/Text Editor可以用来输出文本到Panel上;如果你需要的只是LOG输出到Panel,不需要保存到相关Symbol,那么CAPL Output View可能是你更好的选择演示软硬件环境
Windows11 x64;CANoe 11 SP2 x64

文本输出(CAPL Output View )
- 1️⃣ 放置一个CAPL Output View 控件,背景色设置为黑色,字体设置为绿色,OutPut Mode 默认为Append

2️⃣ 操控控件的CAPL函数
- putValueToControl : 向控件中写入文本
- DeleteControlContent :清空控件文本


3️⃣ 代码演示
- 我们可能在CAPL中执行测试任务时,不断的向Panel中输出测试Log
/*@!Encoding:936*/


 on key 'a'

{

  char timeBuffer[64];
  char tempText[256];
  int i ;


  getLocalTimeString(timeBuffer);
  snprintf(tempText,elCount(tempText),"%s:开始执行测试。。。\n",timeBuffer);
  putValueToControl("ToolBox_CAPLOutView","CAPLOutputView",tempText);

  getLocalTimeString(timeBuffer);
  snprintf(tempText,elCount(tempText),"%s:正在执行测试步骤(1)。。。\n",timeBuffer);
  putValueToControl("ToolBox_CAPLOutView","CAPLOutputView",tempText);

  getLocalTimeString(timeBuffer);
  snprintf(tempText,elCount(tempText),"%s:测试结束,结果PASS\n",timeBuffer);
  putValueToControl("ToolBox_CAPLOutView","CAPLOutputView",tempText);
}
3️⃣ 按下‘a’ 键,输出测试Log


总结


- 要有最朴素的生活,最遥远的梦想,即使明天天寒地冻,路遥马亡!
- 如果这篇博客对你有帮助,请 “点赞” “评论”“收藏”一键三连 哦!码字不易,大家的支持就是我坚持下去的动力。

边栏推荐
- PyTorch主要模块
- 【2】 Grid data display stretch ribbon (take DEM data as an example)
- Alibaba cloud technology expert Qin long: reliability assurance is a must - how to carry out chaos engineering on the cloud?
- PyTorch的生态简介
- Pairwise comparison of whether the mean values between R language groups are the same: pairwise hypothesis test of the mean values of multiple grouped data is performed using pairwise.t.test function
- 2022.07.24 (lc_6124_the first letter that appears twice)
- 【AI4Code】《GraphCodeBERT: Pre-Training Code Representations With DataFlow》 ICLR 2021
- R language ggplot2 visualization: use the ggviolin function of ggpubr package to visualize the violin graph, set the add parameter to add jitter data points and mean standard deviation vertical bars (
- R language ggplot2 visualization: use the ggstripchart function of ggpubr package to visualize the dot strip chart, set the palette parameter to configure the color of data points at different levels,
- 2022.07.24(LC_6124_第一个出现两次的字母)
猜你喜欢

919. Complete binary tree inserter: simple BFS application problem
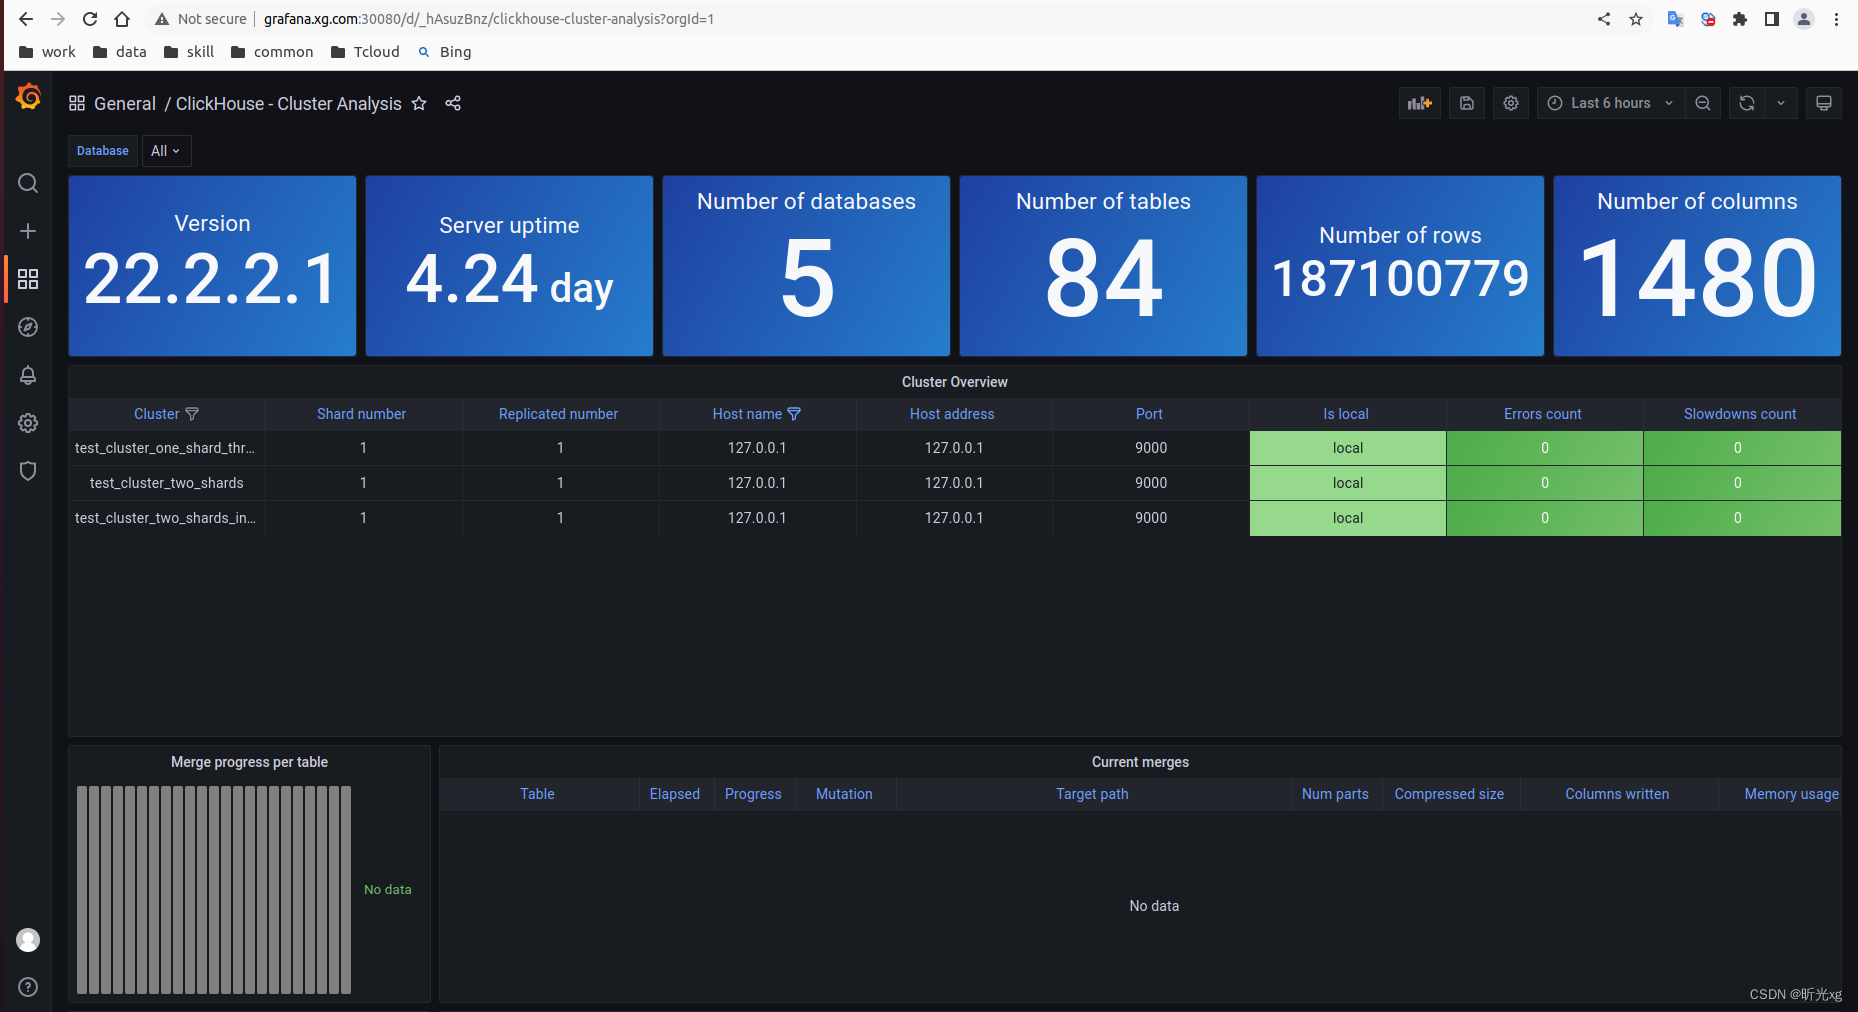
clickhouse笔记03-- Grafana 接入ClickHouse

Crawler crawls dynamic website

3.2.1 what is machine learning?
Software testing interview question: Please list the testing methods of several items?

Pytorch project practice - fashionmnist fashion classification

Visualize the training process using tensorboard
软件测试面试题目:请你列举几个物品的测试方法怎么说?

Fiddler抓包APP

想要做好软件测试,可以先了解AST、SCA和渗透测试

随机推荐
交换机链路聚合详解【华为eNSP】
Visualize the training process using tensorboard
logstash
Leetcode 1184. distance between bus stops
Use of Spirng @conditional conditional conditional annotation
shell基础知识(退出控制、输入输出等)
弹性盒子(Flex Box)详解
【Flutter -- 实例】案例一:基础组件 & 布局组件综合实例
[micro service ~sentinel] sentinel degradation, current limiting, fusing
【十】比例尺添加以及调整
使用TensorBoard可视化训练过程
clickhouse笔记03-- Grafana 接入ClickHouse
R language uses LM function to build multiple linear regression model, step function to build forward stepwise regression model to screen the best subset of prediction variables, and scope parameter t
2022.07.24 (lc_6124_the first letter that appears twice)
Is the securities account opened by qiniu safe? How to open an account
Excuse me, using data integration to import data from PostgreSQL to MySQL database, emoj appears in some data fields
【三】DEM山体阴影效果
perf 性能调试
Dr. water 2
pytorch环境配置及基础知识