当前位置:网站首页>【Matplotlib绘图】
【Matplotlib绘图】
2022-07-23 22:16:00 【In my opinion】
目录
二、Matplotlib绘图基本方法
三、图形绘制
一、Matplotlib是什么?
1.Matplotlib是一个Python的2D绘图库,可轻松生成绘图,直方图,条形图,散点图等
2.matplotlib开发环境搭建:
pip install matplotlib
二、Matplotlib绘图基本方法
1.使用Matplotlib绘图时,有两个常用场景,一是画点,一是画线
2.pyplot基本方法:
| 方法 | 说明 |
| title() | 设置图表的名称 |
| xlabel() | 设置x轴名称 |
| ylabel() | 设置y轴名称 |
| xticks(x,ticks,rotation) | 设置x轴的刻度,rotation旋转角度 |
| yticks() | 设置y轴的刻度 |
| plot() | 绘制线性图表 |
| show() | 显示图表 |
| legend() | 显示图例 |
| text(x,y,text) | 显示每条数据的值,x,y值的位置 |
| figure(name,figsize=(w,h),dip=n) | 设置图片大小 |
| linewidth() | 设置线条粗细 |
三、图形绘制
1.绘制直线
#导入matplotlib模块
import matplotlib.pyplot as plt
#将(0,1)和(2,4)两点连接起来,调用plot方法
plt.plot([0,2],[1,4])    #x在一个列表,y在一个列表
#显示绘制图形
plt.show()
2.绘制折线
#导入matplotlib模块
import matplotlib.pyplot as plt
#准备绘制点
x=[1,2,3,4,5]
y=[1,4,9,16,25]
#调用绘图方法
#调用linewidth设置线条属性
plt.plot(x,y,linewidth=4)
#设置x,y轴名称
plt.xlable('x')
plt.ylable('y=x^2')
#添加图表标题
plt.rcParams['font.sans-serif']=['SimHei']  #用来正常显示中文
plt.title("折线图")
#显示图
plt.show()
注意:Matplotlib默认情况不支持中文,plt.rcParams['font.sans-serif']=['SimHei'] #用来正常显示中文
3.绘制曲线
1>Matplotlib中用plot函数绘制曲线时,需要将200个点的x坐标和y坐标分别以序列形式传入plot函数,然后调用show函数显示图形
2>subplot函数:将画布进行分区,并将图形画到指定区域
'''
#导入模块
import matplotlib.pyplot as plt
#准备x,y坐标
x=range(-100,100)
y=[i**2 for i in x]
#绘制一元二次图形
plt.plot(x,y)
#显示图形且保存图片
plt.savefig('result.jpg')#默认格式为png
plt.show()
'''
#绘制正弦余弦曲线
#导入matplotlib和numpy模块
import matplotlib.pyplot as plt
import numpy as np
#生成0-10之间100个等差数
x=np.linspacce(0,10,100)
sin_y=np.sin(x)
#将画布分为两行两列,图形画在第一部分
plt.subplot(2,2,1)
#绘制图形
plt.plot(x,sin_y)
plt.subplot(2,2,3)
cos_y=np.cos(x)
plt.plot(x,cos_y)
#显示图形
plt.show()
4.绘制散点图
利用scatter函数可以绘制随机点,该函数需要接收x,y坐标的序列
'''
#导入matplotlib和numpy模块
import matplotlib.pyplot as plt
import numpy as np
#生成0-10之间100个等差数
x=np.linspace(0,10,100)
sin_y=np.sin(x)
#绘制散点图
#plt.plot(x,sin_y,'o')
plt.scatter(x,sin_y)
plt.show()
'''
#绘制10种大小,100种颜色散点图
#导入matplotlib和numpy模块
import matplotlib.pyplot as plt
import numpy as np
np.random.seed(0)  #执行多次,每次获取的随机数结果相同
x=np.random.rand(100)
y=np.random.rand(100)
#生成10种大小
size=np.random.rand(10)*1000
#生成100种颜色
color=np.random.rand(100)
#绘制散点图
plt.scatter(x,y,s=size,c=color,alpha=0.7)#alpha表示透明度
#显示图形
plt.show()
'''
点的颜色和点个数要相同
点的大小和点个数可以不同,点的个数大于大小个数,则会循环获取大小
'''
注意:上述例子说明,使用plot和scatter绘制出来的图形没有区别,但是plot绘制速度快于scatter,若画点并且点形式无区别选用plot,若有要求(点的大小与颜色)则使用scatter
5.绘制不同形状不同颜色线条
| 字符 | 颜色 |
| b | 蓝色 |
| c | 青色 |
| m | 品红色 |
| k | 黑色 |
| w | 白色 |
#导入matplotlib和numpy模块
import matplotlib.pyplot as plt
import numpy as np
x=np.linspace(0,10,100)
#利用legend方法添加图例,在plot方法中传入参数label
plt.plot(x,x,'--r',label='--g') #红色——线
plt.plot(x,x+1,'-.g') #绿色-.线
plt.plot(x,x+2,',k') #黑色,线
plt.legend(loc='lower right') #图例默认在左上角,利用loc修改
plt.show()
图例(loc=):lower,upper,left,right组合
fancybox=True:增加边框
framealpha=1:透明度
shadow=True:阴影
borderpad=1:边框宽度
6.绘制柱状图
使用bar函数绘制竖直柱状图,使用barh生成水平柱状图
#导入模块
import matplotlib.pyplot as plt
import numpy as np
#创建x-年份,y-年份对应的销量
x=[2005,2010,2015,2020]
x_label=['2005年','2010年','2015年','2020年']
y=[10000,20000,30000,40000]
#调用bar函数绘制
plt.bar(x,y,width=2) #width修改柱的宽度,为标准宽度的2倍
#正常显示中文
plt.rcParams['font.sans-serif']=['SimHei']
#修改x刻度
plt.xticks(x,x_label)
#修改xy轴名称
plt.xlabel("年份")
plt.ylabel("销量")
plt.show()
同一x值下三个柱并列绘制
plt.bar([i+width for i in x],count,alpha=0.7,width=width)
7.绘制饼状图:使用pie函数进行绘制,传入比例数据
#导入matplotlib和numpy模块
import matplotlib.pyplot as plt
import numpy as np
#准备人数及比例
man=72333
woman=68843
man_per=man/(man+woman)
woman_per=woman/(man+woman)
#添加名称
labels=['男','女']
color=['red','blue']
plt.rcParams['font.sans-serif']=['SimHei']#用来正常显示中文
#绘制饼状图,explode表示两部分之间缝隙,autopct表示比例
paches,texts,autotexts=plt.pie([man_per,woman_per],labels=labels,color=color,explode=(0,0.04),autopct='%0.1f%%')
#设置饼状图中字体颜色
for text in autotexts:
    text.set_color('white')
#设置字体大小
for text in texts+autotexts:
    text.set_fontsize(18)
plt.show()
8.绘制直方图:使用hist函数绘制
'''
#导入模块
import matplotlib.pyplot as plt
import numpy as np
#生成1000个标准正态分布随机数
x=np.random.rand(1000)
#plt.hist(x)
#修改柱的宽度,使用bins
plt.hist(x,bins=10) #10个柱装在一起
plt.show()
'''
#导入模块
import matplotlib.pyplot as plt
import numpy as np
#使用np.random.normal()指定均值和标准差的正态分布
x=np.random.nomal(1,0.5,1000)
y=np.random.normal(2,0.7,1000)
z=np.random.normal(3,0.6,1000)
kwargs=dict(bins=10,alpha=0.7)
plt.hist(x,**kwargs)
plt.hist(y,**kwargs)
plt.hist(z,**kwargs)
plt.show()
9.绘制等高线图和三维图
使用contour方法绘制等高线图
#导入模块
import matplotlib.pyplot as plt
import numpy as np
#创建x,y
x=np.linspace(-10,10,100)
y=np.linspace(10,10,100)
#计算x,y交点X,Y
X,Y=np.meshgrid(x,y)
#计算Z
Z=np.sqrt(X**2+Y**2)
#绘制图形
#plt.contour(X,Y,Z) #未填充
plt.contourf(X,Y,Z) #将图形进行填充
plt.show()
绘制三维图形
#导入模块
import matplotlib.pyplot as plt
#导入3D包
from mpl_toolkits.mplot3d import Axes3D
#创建X,Y,Z
X=[1,1,2,2]
Y=[3,4,4,3]
Z=[1,100,1,1]
figure=plt.figure()
#创建Axes3D对象
ax=Axes3d(figure)
ax.plot_trisurf(X,Y,Z)
plt.show()边栏推荐
- Neo4j应用
- Tools in the tools package of Damon database (operate Damon database)
- Is it safe to open a VIP stock account on your mobile phone?
- Jmeter性能综合实战——签到及批量签到
- 多线程问题:为什么不应该使用多线程读写同一个socket连接?
- How can I open an account to buy financial products with a 6% income?
- Mqtt connection, subscription and publishing can be realized without mqtt C library
- El upload realizes the preview of uploaded files
- [golang learning notes] is parameter transfer in go language value transfer or reference transfer
- 大学数据库创建与查询实战——数据库表设计
猜你喜欢
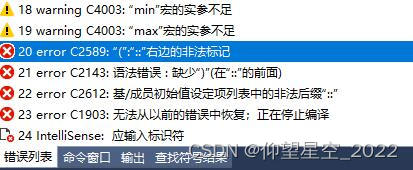
PCL error: error c2589 "(": "::" illegal mark on the right)

U++ learning notes control object scale

MySQL的JDBC编程
MySQL index transaction

Sudoku written for once and for all

Altium Designer - schematic diagram of Arduino uno & PCB diagram (self-made Arduino board)

Taobao assistant is disabled. What is the reason for using the big Taoying import data package to upload the baby prompt "the main image is required and cannot be empty"? How to solve it?

LeetCode高频题62. 不同路径:机器人从左上角到右下角的路径有多少条?纯概率排列组合问题,而不是动态规划题

Application of performance test knowledge to actual combat

STM32+ESP8266+MQTT协议连接阿里云物联网平台
随机推荐
海外资深玩家的投资建议(3) 2021-05-04
138 - query case - knowledge points involved: foreach traversal & computed calculation attributes & V-for loop
Lambda learning (the use of comparator after sort and collectors.groupingby after collection)
A stack of digital robots were selected in Gartner's China AI market guide
多线程问题:为什么不应该使用多线程读写同一个socket连接?
lambda学习(sort后面的Comparator的使用,collection后使用Collectors.groupingBy分组)
U++学习笔记 TSubclassOf()
jedis 6---redisson和jedis的入门和不同
10道面试基础笔试题,你能对几题?
Leetcode high frequency question 53. maximum subarray sum, continuous subarray with maximum sum, return its maximum sum
小说里的编程 【连载之二十】元宇宙里月亮弯弯
Pulsar open source message queue_ Understand pulsar --- pulsar work notes 001
YOLO7 口罩识别实战
【HiFlow】腾讯云新一代自动化助手,我用它完成了企业疫情提示(无代码)
did you register the component correctly
软件体系结构期末复习六十题
Machine learning exercises -- right rate regression
如何彻底强制杀死后台无关进程?
[mathematical modeling summer training] location of distribution center
Investment suggestions for overseas senior players (3) 2021-05-04